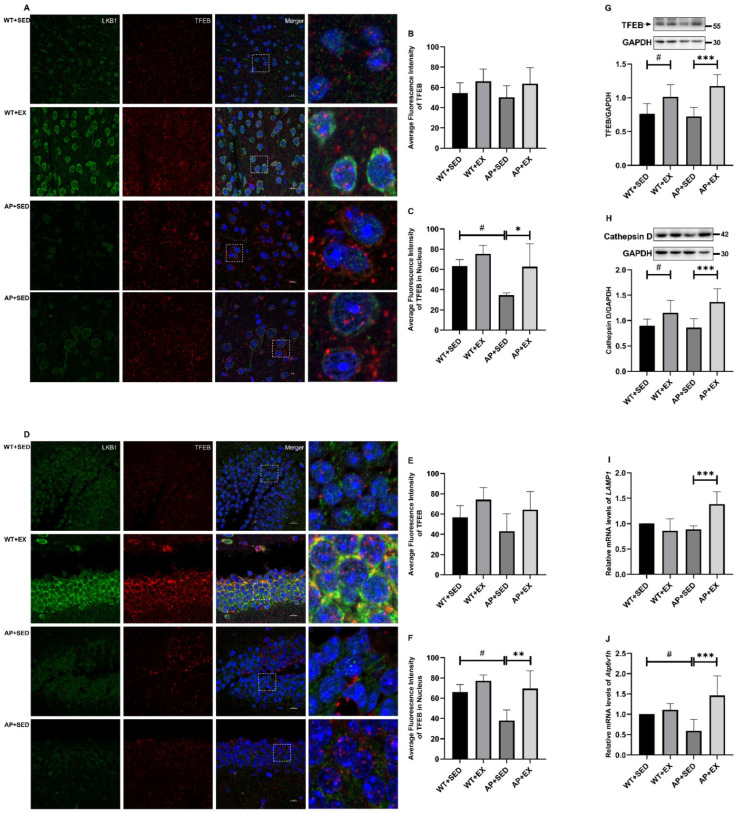
Figure 8.
Exercise-activated TFEB enhances lysosomal function in brain cells. (A,D) Representative images of double immunofluorescence in mouse cortex and hippocampus (The green fluorescence is LKB1; the red fluorescence is TFEB; the blue fluorescence is the nucleus; the white dashed-square box is the area of the enlarged image). Scale bar: 10 μm. n = 3 per group. (B,C,E,F) Histograms showing the mean fluorescence intensity of TFEB and intranuclear TFEB in the cortex and hippocampus ((B) TFEB in cortex; (C) TFEB in the nucleus of the cerebral cortex; (E) TFEB in the hippocampus; (F) TFEB in the nucleus of the hippocampus). Relative protein levels of (G) TFEB and (H) cathepsin D in brain tissue (n = 6). Relative expression levels of (I) LAMP1 and (J) Atp6v1h mRNA in brain tissue (n = 5). Data are presented as means ± SDs. # p < 0.05 vs. WT + SED mice, * p < 0.05, ** p < 0.01, and *** p < 0.001 vs. AP + SED mice.

