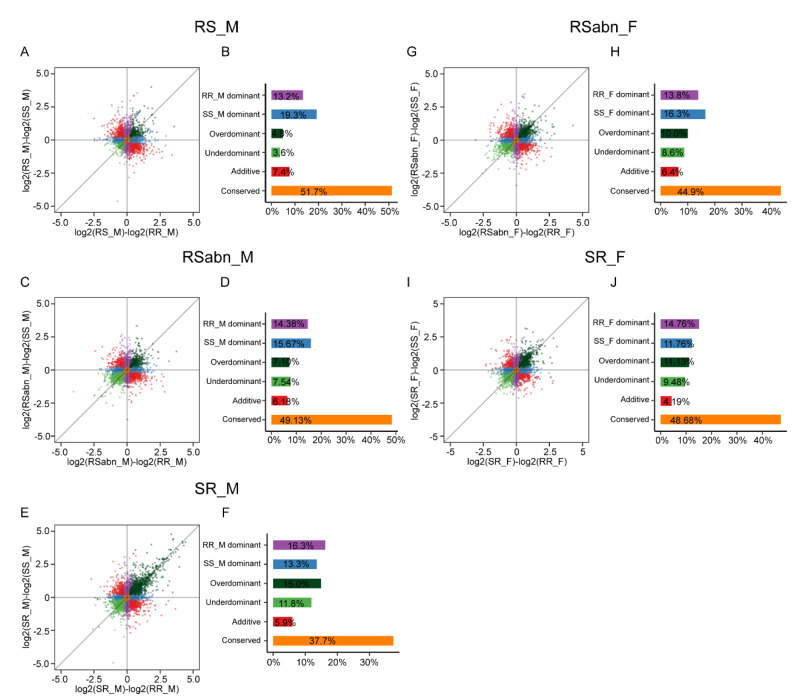
Figure 3.
Inheritance modes of antennal gene expression in the five groups of F1 hybrids of H. armigera and H. assulta. Scatterplot in panels (A,C,E,G,I) illustrates the differences in expression level (log2(fold-change)) between F1 hybrids and each of the parental species. The X-axis represents the difference between RS_M and RR_M (A), RSabn_M and RR_M (C), SR_M and RR_M (E), RSabn_F and RR_F (G), and SR_F and RR_F (I); the Y-axis represents the difference between RS_M and SS_M (A), RSabn_M and SS_M (C), SR_M and SS_M (E), RSabn_F and SS_F (G), and SR_F and SS_F (I). Each point represents a single gene and is color-coded according to the inferred inheritance modes. Bar plots of panels (B,D,F,H,J) show the proportions of genes with different inheritance modes expressed in the antennae of RS_M (B), RSabn_M (D), SR_M (F), RSabn_F (H) and SR_F (J).

