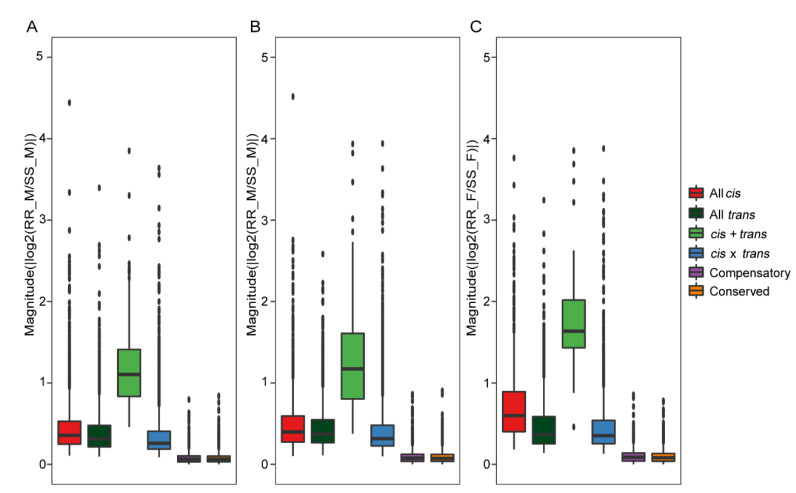
Figure 5.
Expression divergence caused by regulatory patterns. (A–C) Boxplots showing the magnitude of expression divergence between species for genes classified as regulatory patterns in fertile F1 hybrids (RS_M (A), SR_M (B) and SR_F (C)), with regulatory patterns on the X-axis and a magnitude of expression divergence on the Y-axis. Differences in regulatory patterns were significant as indicated by Wilcoxon rank-sum tests.

