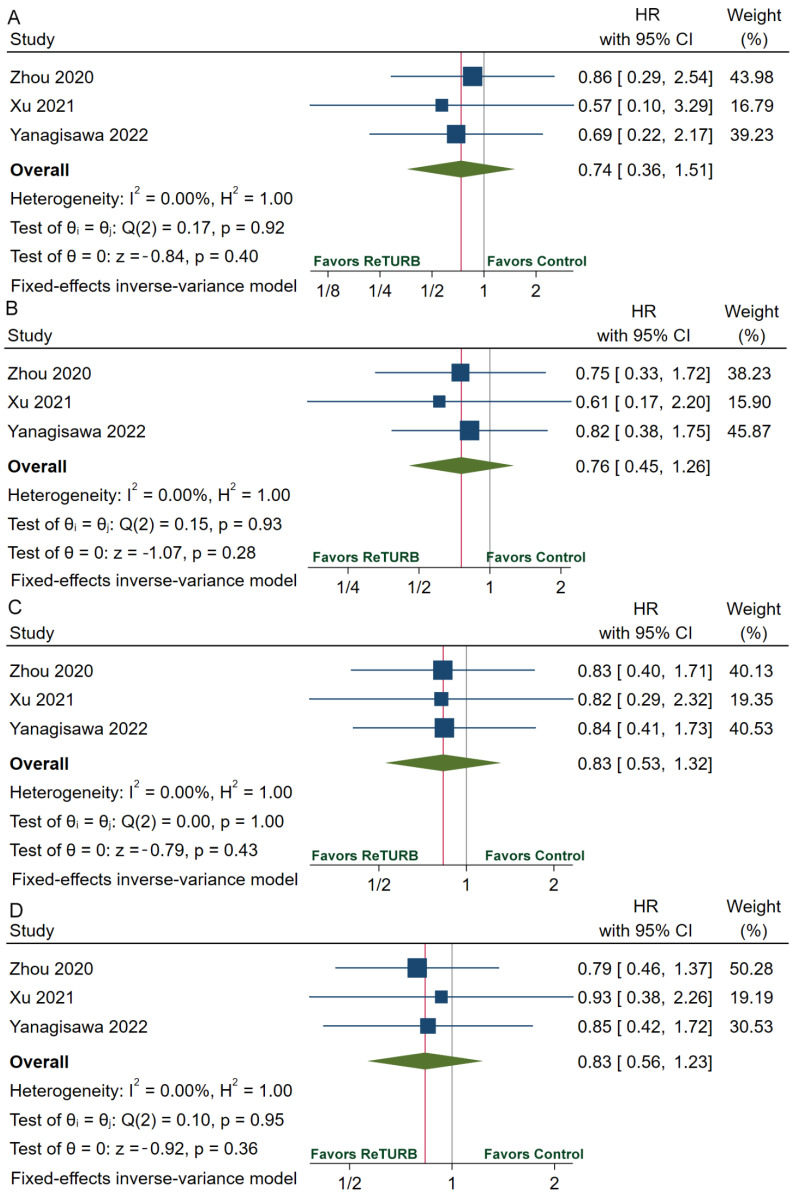
Figure 3.
Forests plots of comparisons of 1-year RFS (A), 2-year RFS (B), 3-year RFS (C), and 5-year RFS (D) between the reTURB group and control group [32,36,38]. The gray lines represent the reference lines and the red lines show the pooled effect sizes. RFS: recurrence-free survival; HR: hazard ratio; reTURB: repeat transurethral resection of bladder tumors; CI: confidence interval.

