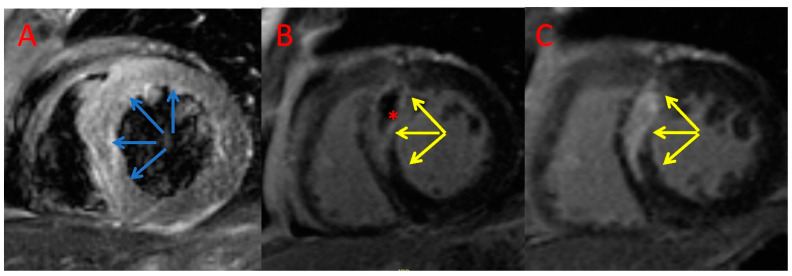
Figure 3.
Example CMR images of a patient treated with an AT + PCI. Index T2-weighted triple inversion recovery (A) and late gadolinium enhancement imaging (B) and CMR follow-up late gadolinium enhancement (C) imaging acquired in the short axis. Blue arrows—area at risk; yellow arrows—late gadolinium enhancement; *—microvascular obstruction.

