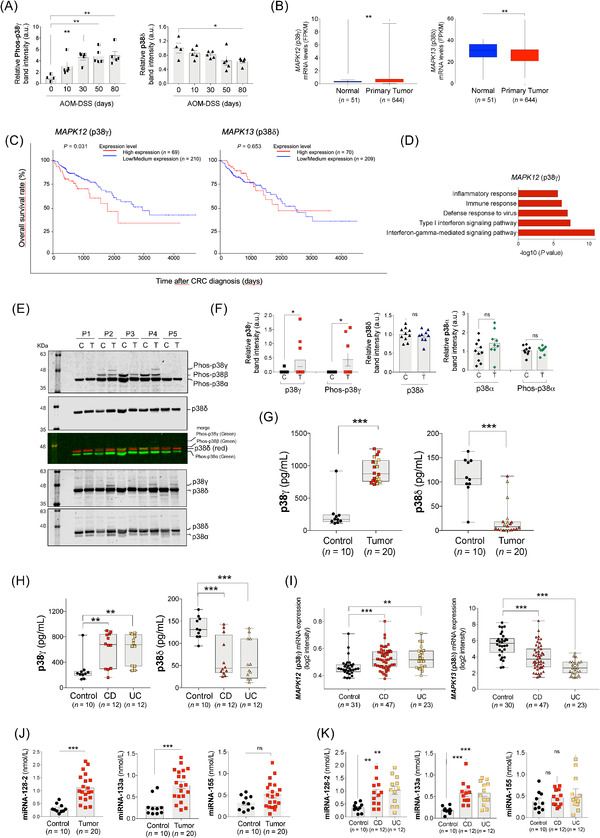
FIGURE 1.

p38γ and p38δ regulation in CRC and IBD. (A) WT mice were treated with AOM and DSS as described in Supplementary Figure S1A. Colon extracts (50 μg) from AOM‐DSS‐treated WT mice were immunoblotted with antibodies to phosphorylated p38MAPKs and total p38α, p38γ and p38δ, as shown in Supplementary Figure S1D. Phospho‐p38γ and p38δ bands were analyzed and quantified. (B) MAPK12 (p38γ) and MAPK13 (p38δ) mRNA expression levels in normal and primary CRC tumor tissues from the TCGA database. (C) Survival analysis (Kaplan‐Meier plot with log‐rank test) of CRC patients from the TCGA dataset (in UALCAN portal) stratified by MAPK12 (p38γ) and MAPK13 (p38δ) mRNA expression levels. (D) Enrichment analysis of GO biological processes of the genes whose expression positively correlates with MAPK12 (p38γ). (E) Organoid lysates (20 μg) from tumors (T) or normal tissues (C) from CRC patients (P1‐5) were immunoblotted sequentially with the following antibodies, from top to bottom: 1) anti‐phos‐p38MAPK: secondary anti‐rabbit green (this antibody recognizes all phospho‐p38MAPK isoforms); 2) anti‐p38δ: secondary anti‐sheep red (merge image of these two blots is shown in the figure); 3) anti‐p38γ: secondary anti‐sheep red (total p38δ can be also visualized), and 4) anti‐p38α: secondary anti‐rabbit red (total p38δ can be also visualized). Blots were analyzed using the Odyssey infrared imaging system. The identity of the isoforms was determined, as in Supplementary Figure S1E‐F, by their different mobility in the SDS‐PAGE gel (to distinguish p38γ from p38α, p38δ and p38β) and by using simultaneously specific antibodies for a particular p38MAPK isoform (in red) and anti‐phospho‐p38MAPK antibody (in green). After analysis of the blots in the Odyssey infrared imaging system, phospho‐p38MAPK bands should be yellow when colors were merged. (F) Total and phospho‐protein bands of all organoid samples (9 organoids derived from tumor tissues and 10 from normal tissues) shown in panel (E) and Supplementary Figure S4B were quantified using ImageJ. As a control, p38α expression and phosphorylation were examined, and they were similar in organoids from normal and tumor tissues. (G) p38γ and p38δ expression in plasma samples from 20 colon cancer patients and 10 healthy controls were measured by ELISA. Black dots represent the data of healthy donors; red symbols represent the data of CRC patients without IBD; yellow symbols represent the data of CRC patients with IBD. (H) p38γ and p38δ protein expression in the plasma samples from IBD (CD and UC) patients were measured by ELISA. (I) MAPK12 (p38γ) and MAPK13 (p38δ) mRNA expression in IBD (UC and CD) patients and healthy controls using data from GEO (GSE179285). Colon tissues were collected from patients with UC; colon and ileum tissues were collected from patients with CD and healthy donors. (J, K) Expression of miRNAs in the plasma samples from colon cancer (J) and colitis patients (K). miRNA‐128‐2, miRNA‐133a and miRNA‐155 were measured by FLEET CTD analysis in plasma samples from 20 healthy donors (10 for CRC and 10 for IBD), 20 colon cancer patients, 12 UC and 12 CD patients. Data are shown as mean ± SEM. Student's t‐test was used for comparison. ns, not significant; *P ≤ 0.05; **P ≤ 0.01; ***P ≤ 0.001. Abbreviations: AOM: azoxymethane; CD: Crohn's disease; CRC: colorectal cancer; DSS: dextran sodium sulfate; FPKM: fragments per kilobase of transcript per million mapped reads; ELISA: enzyme‐linked immunosorbent assay; GEO: gene expression omnibus; GO: gene ontology; IBD: inflammatory bowel disease; MAPK: mitogen‐activated protein kinase; miRNA: microRNAs; p38γ/p38δ: p38γ and p38δ; SDS‐PAGE: sodium dodecyl sulfate‐polyacrylamide gel electrophoresis; SEM: standard error of the mean; TCGA: The Cancer Genome Atlas; UC: ulcerative colitis; WT: Wild type; au, arbitrary units
