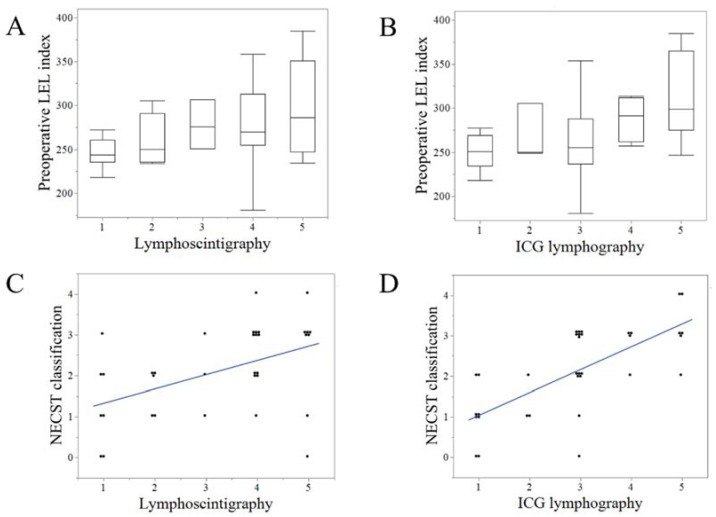
Figure 5.
Correlation between the clinical severity staging of lymphedema and lymphoscintigraphy and ICG lymphography. The preoperative LEL index exhibited a mild correlation with lymphoscintigraphy (r = 0.35, p = 0.03) (A) and moderate correlation with ICG lymphography (r = 0.45, p < 0.001). (B) The normal, ectasis, contraction, and sclerosis type classification (NECST) exhibited a strong positive correlation with ICG lymphography (r = 0.72, p < 0.001) (C) and a moderate correlation with lymphoscintigraphy (r = 0.47, p < 0.01) (D). ICG, indocyanine green; LEL, lower extremity lymphedema.

