Fig. 6.
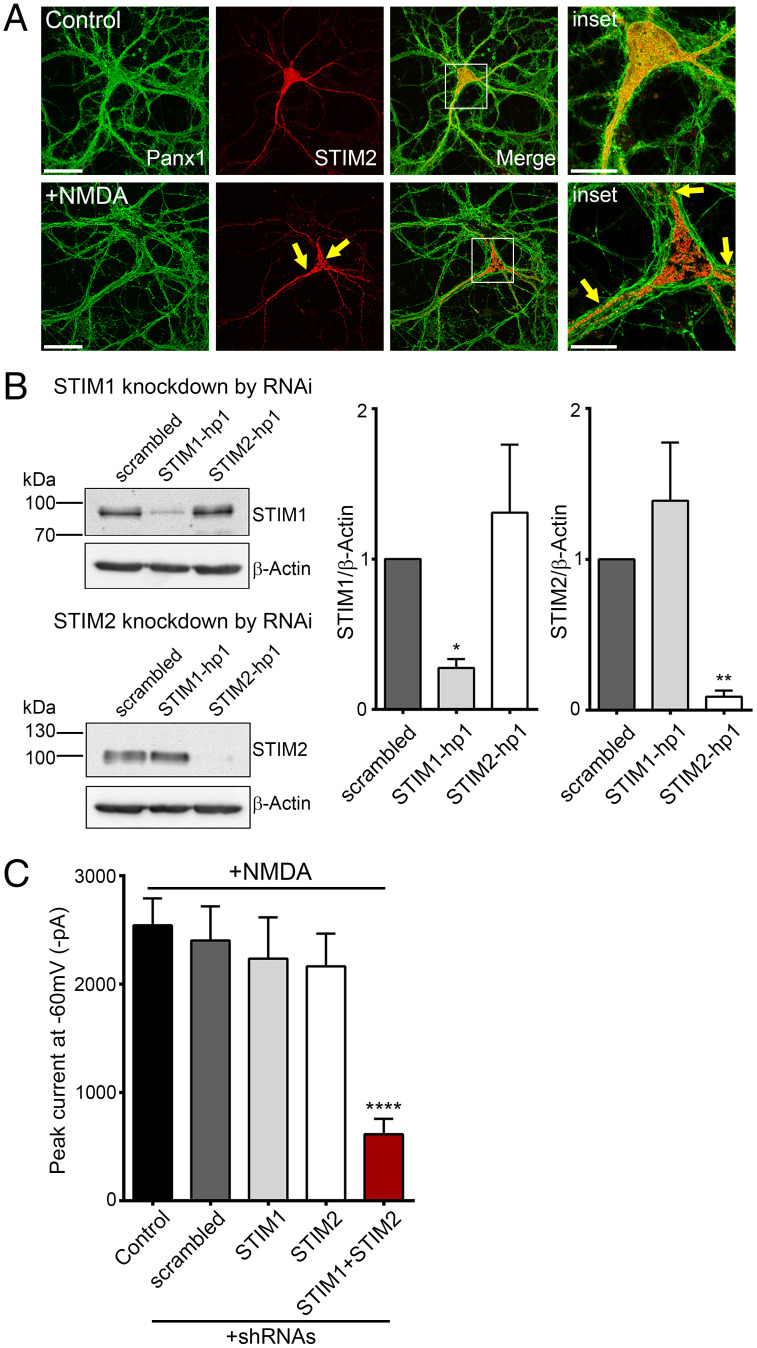
NMDAR-stimulated Panx1 currents require STIM1/2 in hippocampal neurons. (A) Representative image confirming expression of Panx1-eGFP and mCherry-STIM2 in lentivirus-infected Panx1 KO neurons. Compared with control, NMDA-treated neurons (100 µM, 5 min) show change in STIM2 distribution and puncta formation (marked with arrows). Scale bars, 50 µm; inset scale bars, 20 µm. (B) Representative blots (Left) showing expression of STIM1, STIM2, or β-actin in neurons expressing shRNAscrambled, shRNASTIM1-hp1, or shRNASTIM2-hp1. Results from three experiments were quantified densitometrically, and band intensities were normalized to β-actin (Right). *P < 0.05 and **P < 0.01, RM one-way ANOVA with post hoc Bonferroni test compared to scrambled. (C) Summary data from a series of recordings demonstrating that NMDA treatment–induced Panx1 currents are inhibited when both STIM1 and STIM2 are knocked down in neurons coexpressing shRNASTIM1-hp1 and shRNASTIM2-hp1. ****P < 0.0001, one-way ANOVA with post hoc Bonferroni test when STIM1+STIM2 (n = 28) were compared with control (n = 16) and scrambled (n = 17). No significant difference was seen when STIM1 (n = 8) and STIM2 (n = 8) were compared with control and scrambled. Data are represented as mean ± SEM (B and C).

