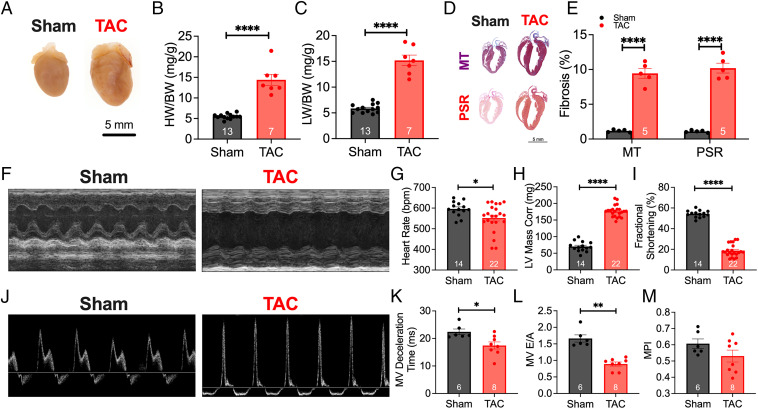
Fig. 1.
Transverse aortic constriction–induced heart failure. (A) Representative images of hearts taken 8 wk after the sham or TAC operations. (B and C) Summary data of heart weight–to–body weight (HW/BW) (B) and lung weight–to–body weight (LW/BW) (C) ratios are shown. (D) Cardiac sections were stained with Masson’s trichrome and Picrosirius red to assess collagen content, as depicted in the representative images. (E) Summary data of collagen deposition for both MT and PSR are shown. Conscious ECG was used to determine cardiac structure and function. (F) Representative M-mode images at the parasternal short axis are depicted. (G–I) Summary data for heart rate (G), LV mass–corrected (H), and fractional shortening (I) are shown. (J) Representative images of blood flow through the MV, assessed using pulsed-wave Doppler ECG to quantify diastolic function. (K–M) Quantification of MV deceleration time (K), MV E/A ratio (L), and myocardial performance index (MPI) (M) are depicted. Data are expressed as mean ± SEM. Gray and red bars are data from sham compared with TAC mice, respectively. *P < 0.05, **P < 0.01, and ****P < 0.0001. The numbers shown within the bar graphs represent the numbers of animals.

