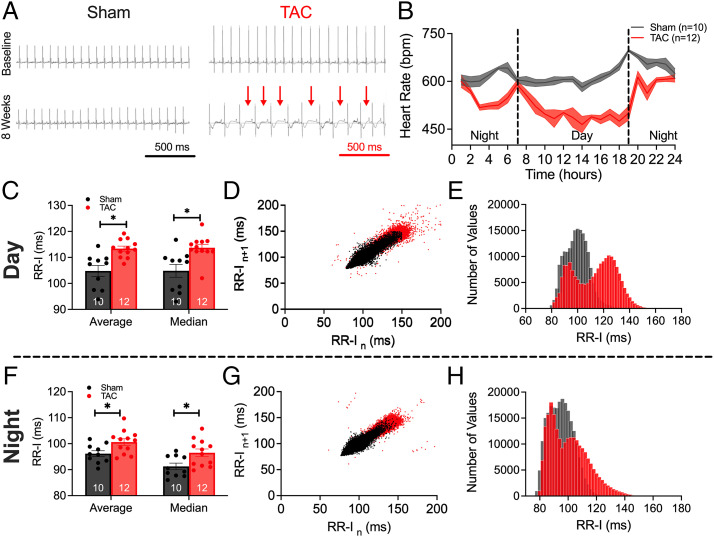
Fig. 2.
HF mice exhibited sinus bradycardia. (A) Representative ECG tracings during the 24-h recording periods at baseline and 8 wk for sham-operated and TAC mice. Red arrows indicate prolonged RR intervals. (B) Summary data of the time course of heart rates from 24-h ECG tracings showing the circadian rhythms. bpm, beats per minute. (C–E) Summary data of average and median RR-I (C), scatterplots of HRV (D), and histograms of the distribution of RR-I in sham and TAC mice (E), measured for daytime hours. (F–H) Similarly for nighttime in summary data of average and median RR-I (F), HRV (G), and histograms (H). Data are expressed as mean ± SEM. *P < 0.05. Numbers within the bar graphs represent numbers of animals.

