Fig. 4.
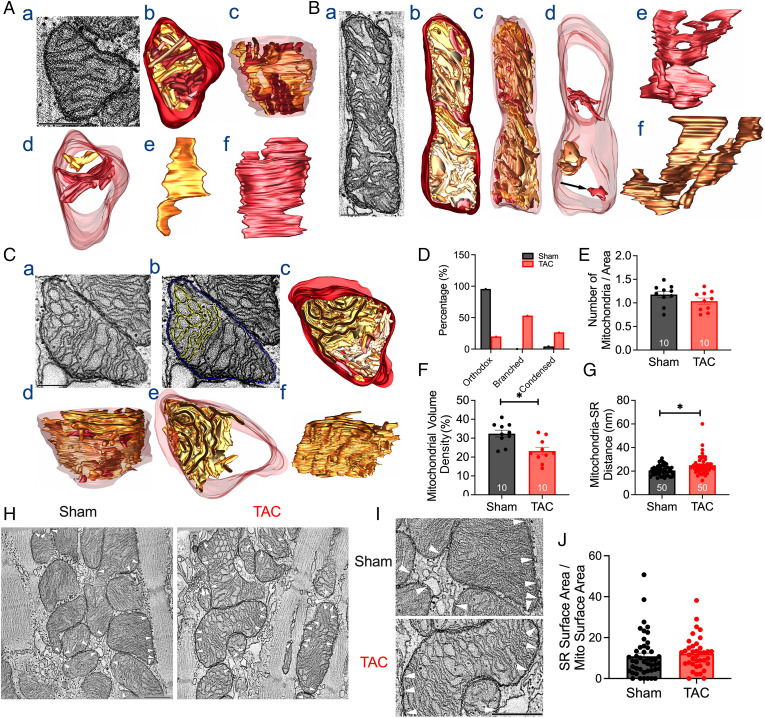
HF-induced morphological changes in SAN mitochondria. (A) Representative images of 3D reconstructions from EM tomography of a SAN mitochondrion from sham mice. Cristae are shown in various shades of brown, and the outer mitochondrial membrane (OMM) is shown in maroon. (a) The orthodox morphotype depicted here is a 1.6-nm-thick slice through the middle of a 400-nm-thick volume. (b) Top view of the surface-rendered volume of the mitochondrion after segmentation of the membranes. (c) Side view of the surface-rendered volume with the OMM made translucent. (d) Top view showing two representative cristae. (e and f) The two cristae are shown from the side. The second crista is wider and extends across the width of the mitochondrion for most of its height. (B) Representative images of 3D reconstructions of a SAN mitochondrion from TAC mice, showing a condensed mitochondrion. (a) The condensed type is shown here, with a 1.6-nm-thick slice through the middle of a 400-nm-thick volume. (b) Top view of the surface-rendered volume of the mitochondrion after segmentation of the membranes. (c) Side view of the surface-rendered volume of the OMM made translucent. (d) Top view showing three representative cristae. The top two are branched, with the lower of the two showing a portion of the top condensed (*). The arrow (Bottom) indicates the crista is a typically enlarged crista with no branching. (e and f) The top two cristae are shown from the side to emphasize their branching. (C) Representative images of 3D reconstructions of a SAN mitochondrion from TAC mice, showing a highly branched mitochondrion. (a) A 1.6-nm-thick slice through the middle of a 400-nm-thick volume shows the circular branching. (b) The same slice shows the extensive connectivity of a single crista (yellow). The OMM is in blue. (c) Top view of the surface-rendered volume of the mitochondrion after segmentation of the membranes. (d) Side view of the surface-rendered volume with the OMM made translucent. (e) The top view shows the highly branched crista to emphasize that it occupies roughly half of the mitochondrial volume. (f) Side view of the highly branched crista, which is seen to consist nearly entirely of connected lamella membranes. Scale bars in A–C represent 500 nm. Summary data of the percentage of mitochondria type (D), number of mitochondrial per area (E), mitochondrial volume (F), and mitochondria–SR distance are shown (G). (H) Representative EM images showing mitochondria–SR contact sites (white arrowheads) from sham and HF SANCs. (I) Enlarged portions of the EM images from H. (Scale bars, 500 nm [H and I].) (J) Summary data for SR contact surface area/mitochondria surface area for sham and HF SANCs (n = 46 and 37 mitochondria for sham and HF SANCs, respectively). Data are expressed as mean ± SEM. *P < 0.05.

