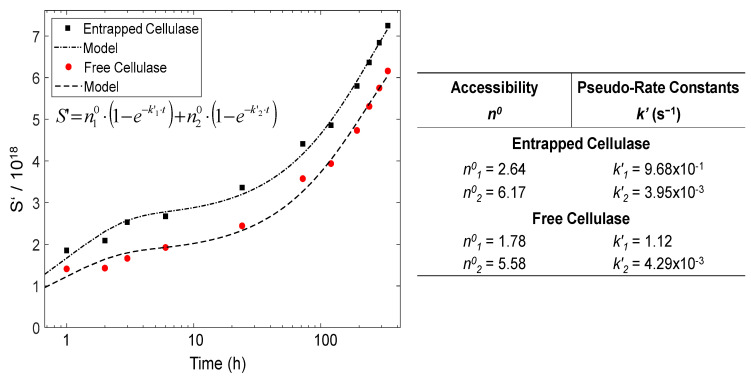
Figure 10.
Evolution of the fraction of hydrolyzed glycosidic bonds S’ with the hydrolysis time during the enzymatic degradation of CNFs by the entrapped cellulase in comparison to the free enzyme. Table on the right displays the accessibility n0 and pseudo-rate constant k’ values obtained for the hydrolysis of CNFs by the entrapped and the free cellulase, by modeling the experimental data with the sum of parallel first-order kinetics in the regimes 1 and 2 (Equation (6)).

