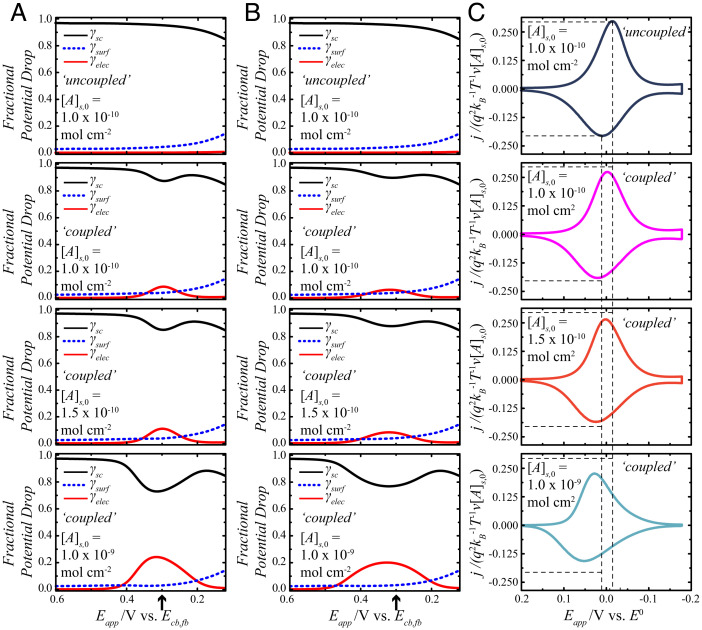
Fig. 4.
Effect of electrostatic coupling between the charges at the planes of the semiconductor electrode and of electron transfer for a redox adsorbate on a lightly doped n-type semiconductor electrode. The full list of calculation values is contained in SI Appendix, Table S1. (A) The fractional potential drops on the forward sweep are represented as γsc (black solid lines), γsurf (blue dashed lines), and γelec (red solid lines) as a function of potential. The potential scale is referenced to the conduction band–edge value at the flat band, Ecb,fb. The arrow on the x axis denotes Eapp = E0. (B) The corresponding fractional potential drops on the reverse sweep are shown as a function of potential. The arrow on the x axis denotes Eapp = E0. (C) Calculated j-Eapp responses for a redox adsorbate with a standard potential that is +0.3 V relative to Ecb,fb. The y axes on these plots are normalized so as to compare directly the current densities at different concentrations of the redox adsorbate, [A]s,0. These plots use the specific γsc, γelec, and γsurf values from A and B in Eqs. 1, 23, and 31 and assume a scan rate of 0.1 V s−1. The top row represents the results for a reference condition where the charges are uncoupled. The subsequent rows indicate the effect of increasing [A]s,0 with electrostatic coupling.

