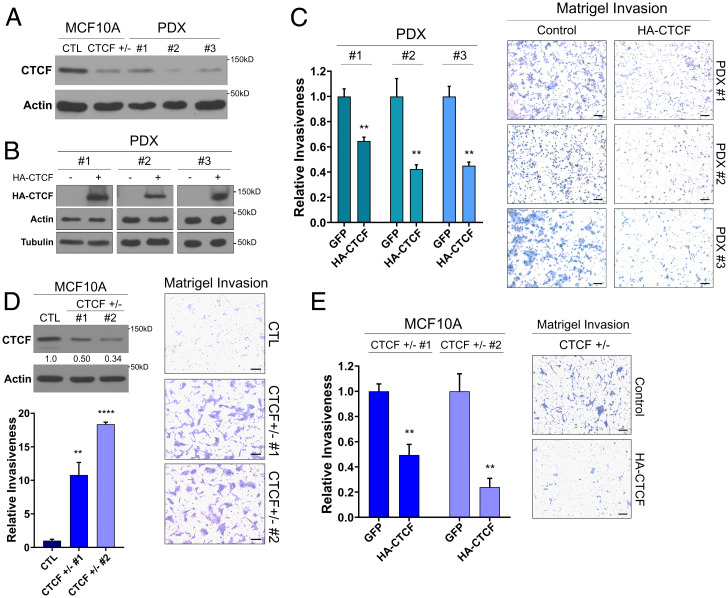
Fig. 1.
CTCF loss of heterozygosity promotes invasiveness and unorganized growth in distinct breast epithelial models. (A) Western blot showing low levels of CTCF, similar to the CTCF+/− MCF10A, in the PDX cells. Loading CTL: actin. (B) Western blot of ectopic HA-CTCF expression in PDX cell lines. Loading CTLs: actin and tubulin. (C) Decrease in relative invasiveness of HA-CTCF PDXs to their respective GFP CTLs (mean ± standard error of mean (SEM]). P = 0.0031, 0.0084, and 0.0015 for PDX 1, 2, and 3, respectively. (D) Western blot of low CTCF levels in CTCF+/− compared to CTL MCF10A. Quantification of relative CTCF band intensity in CTCF+/− to CTL. Loading CTL: actin. Bar chart of the increased relative invasiveness of CTCF+/− to CTL (mean ± SEM). P = 0.0066 and P < 0.0001 for CTCF+/− 1 and 2, respectively. (E) Decrease in relative invasiveness of CTCF+/− MCF10A with HA-CTCF addback to their respective GFP CTLs (mean ± SEM). P = 0.0013 for both CTCF+/− 1 and 2. P value indicators, *P = 0.05, **P = 0.01, ***P = 0.001, ****P = 0.0001. See also SI Appendix, Fig. S1.

