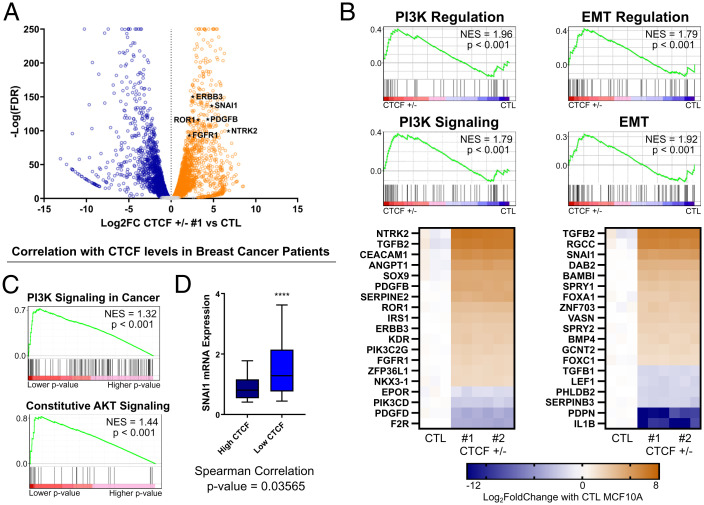
Fig. 2.
RNA-seq reveals oncogenic expression underlying the invasive phenotypes. (A) Volcano plot of transcriptomic changes between CTCF+/− 1 and CTL MCF10A. Genes of the PI3K and EMT pathways, marked as black stars, are among the top up-regulated genes. (B) Top: GSEA of Gene Ontology PI3K pathways and EMT pathways up-regulated in CTCF+/− MCF10A compared to CTL. Bottom: Heatmaps of the top 20 most up- or down-regulated genes, ranked by abs(log2FC), in the PI3K and EMT regulation pathways. (C) Most enriched pathway by P value (PI3K signaling) and NES (Akt signaling) following GSEA prerank analysis of genes significantly correlating with CTCF expression in TCGA breast cancer patient RNA-seq data. Genes were ranked by −log(Spearman test P value). (D) Box plot (10th to 90th percentile) of higher SNAI1 expression levels in low-CTCF breast tumors (P < 0.0001, one-tailed Student’s t test) detected by RNA-seq in TCGA breast cancer patients for tumors in the top 20% of low CTCF expression compared to the top 20% of high CTCF expression. The P value for the Spearman correlation test is also noted. Scale bars represent distribution or mRNAs, from minimum (low bar) to maiximum (upper bar). See also SI Appendix, Fig. S2.

