Fig. 3.
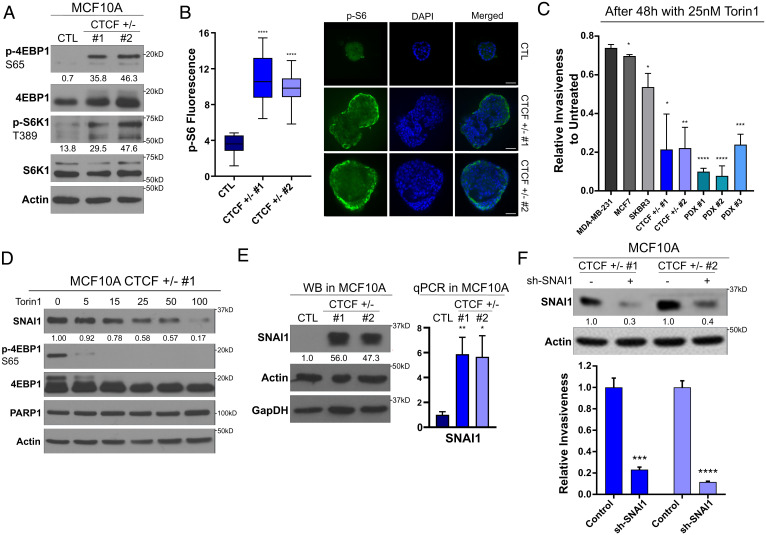
The PI3K pathway and SNAI1 are central for the oncogenic properties of CTCF+/− cells. * values for P values as indicated in Fig. 1. (A) Western blot showing maintained phosphorylation of mTORC1 targets under serum-free conditions in CTCF+/− cells. Quantification represents the band intensity normalized on background. Loading CTL: actin. (B) Mammosphere immunofluorescence and quantification of increased S6 fluorescence of the outer layer of the mammosphere in CTCF+/− compared to CTL MCF10A. Bars represent minimum and maximum values. P < 0.0001 for CTCF+/− 1 and 2 compared to CTL. (C) Invasiveness following 48 h of 25 nM Torin1 treatment normalized relative to the untreated invasiveness of each cell line (mean ± SEM). P values comparing each cell line to the relative invasiveness of MDA-MB-231: MCF7 = 0.031508, SKBR3 = 0.019340, CTCF+/− 1 = 0.018925, CTCF+/− 2 = 0.003089, PDX 1 = 0.000002, PDX 2 = 0.000076, and PDX 3 = 0.000262. (D) Western blot, using serum-free conditions, for SNAI1 levels and 4EBP1 phosphorylation following 24 h of Torin1 treatment. Quantification of SNAI1 band intensity relative to untreated levels is shown below each blot. Loading CTLs: PARP1 and actin. (E) Western blot (WB) of SNAI1 levels in CTCF+/− MCF10A cells. Quantification of relative SNAI1 band intensity to CTL is shown below the topmost blot. Loading CTLs: actin and GapDH. Bar chart (mean ± SEM) of qPCR validation of SNAI1 overexpression at the mRNA levels. (F) Western blot of SNAI1 levels following anti-SNAI1 short hairpin RNA treatment. Bottom: Quantification of relative SNAI1 band intensity to shCTL. Loading CTL: actin. Bar chart of decreased relative invasiveness of the shSNAI1-treated CTCF+/− MCF10A compared to shCTL treated (mean ± SEM). P = 0.00103 and P = 0.000141 for CTCF+/− 1 and CTCF+/− 2 respectively. All P values were calculated using Student’s t test.

