Fig. 4.
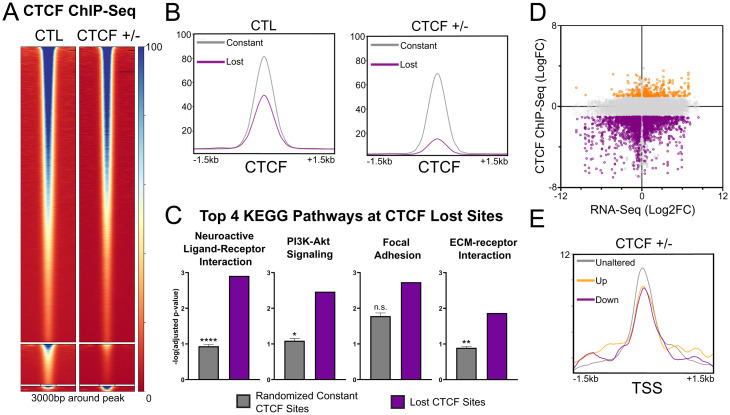
CTCF depletion alters the CTCF DNA binding pattern. (A) CTCF ChIP-seq heatmap of constant, lost, and gained sites (Top to Bottom). (B) Reduced average CTCF ChIP-seq read density of lost sites compared to constant sites in the CTL and CTCF+/− MCF10A. (C) Differential enrichment of the top 4 KEGG pathways, dominated by PI3K- and ECM-related pathways (ranked by geneRatio), at lost sites of CTCF compared to 100 equinumerous subsets of constant sites (mean ± SEM). n.s. = not significant (D) Dot plot of gene expression (log2FC) and CTCF binding (logFC) changes between CTCF+/− and CTL MCF10A for binding sites colocalizing (±3 kb) with expressed genes. Lost sites (purple) are found in proximity to both up- and down-regulated genes. Gained sites (orange) are differentially found in proximity to up-regulated genes. (E) Decreased average CTCF ChIP-seq read density in CTCF+/− MCF10A at the TSSs of all up-regulated genes (adjusted P < 0.05, log2FC > 1) and down-regulated genes (in purple, adjusted P < 0.05, log2FC < −1) compared to unaltered genes [adjusted P > 0.05, abs(log2FC) < 0.5]. See also SI Appendix, Fig. S3.

