Fig. 5.
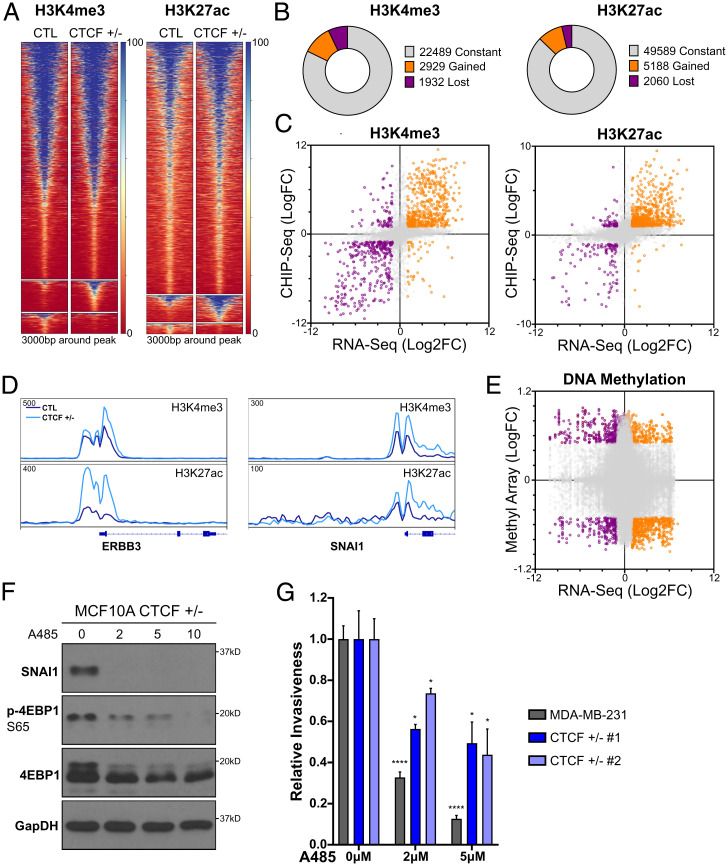
Epigenetic reprogramming of activating histone marks drives changes in gene expression. (A) H3K4me3 and H3K27ac ChIP-seq heatmaps for constant, gained, and lost sites (Top to Bottom). (B) Partitioning of constant, gained, and lost clusters from A. (C) Dot plot of highly correlating gene expression (log2FC) and H3K4me3 or H3K27ac (logFC) changes between CTCF+/− and CTL MCF10A for binding sites colocalizing (±3 kb) with expressed genes. (D) ChIP-seq track of the normalized read density for H3K27ac or H3K4me3 surrounding ERBB3 and SNAI1. (E) Dot plot of gene expression (log2FC) and EPIC methyl array (logFC) changes between CTCF+/− and CTL MCF10A for binding sites colocalizing (±3 kb) with expressed genes. (F) Western blot, under starved conditions, for 4EBP1 phosphorylation and SNAI1 levels following 48 h of HATi A485 treatment (in micromolars). (G) Relative invasiveness of A485-treated CTCF+/− MCF10A and CTL MDA-MB-231 (mean ± SEM) . P values of treated compared to untreated cells; 2 μM A485: MDA-MB-231 < 0.0001, CTCF+/− 1 = 0.0444, and CTCF+/− 2 = 0.0232; 5 μM A485: MDA-MB-231 < 0.0001, CTCF+/− 1 = 0.0284, and CTCF+/− 2 = 0.0252. See also SI Appendix, Fig. S4.

