Fig. 6.
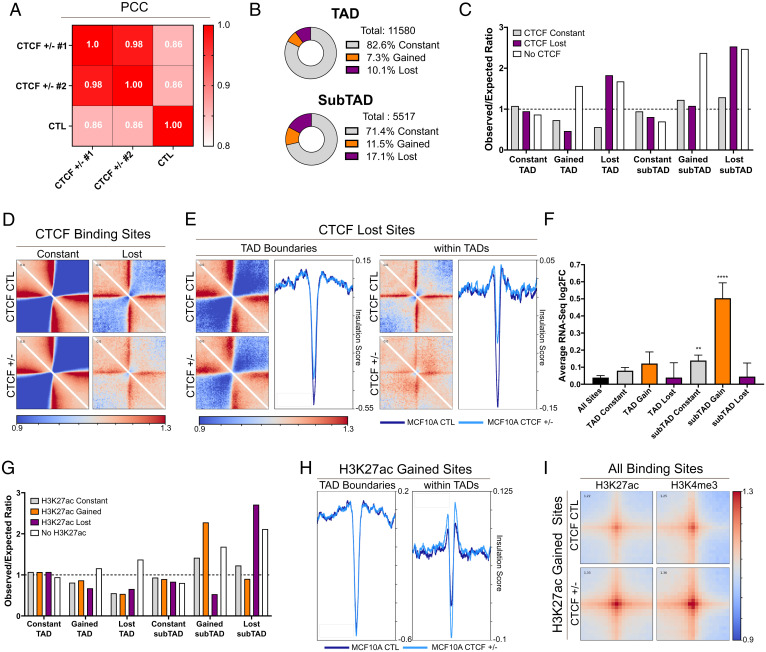
Loss of subTAD insulation drives gene expression changes. (A) Pearson correlation coefficient (PCC) heatmaps showing diverging contact frequencies between CTCF+/− 1 and 2 and CTL. (B) Partitioning of constant, gained, and lost TAD and subTAD boundaries (±10 kb). (C) Enrichment of CTCF sites at boundaries (ratio of observed to expected (O/E)), showing an association between loss of CTCF and lost boundaries and absence of CTCF and altered boundaries. These are both more pronounced for subTAD boundaries. (D) Pileup plots showing local interaction, relative to randomize average genomewide interaction, around constant and lost sites of CTCF (range: 200 kb). CTCF lost sites show less insulation in CTL MCF10A, which is further reduced upon loss of CTCF. (E) Pileup plots of local interactions at CTCF sites localizing at TAD boundaries or within TADs. The profile plot of the average insulation score in each region quantifies the specific loss of insulation observed at lost sites of CTCF within TADs. (F) Average RNA-seq log2FC between CTCF+/− and CTL of genes colocalizing with TAD and subTAD boundaries (±10 kb) (mean ± SEM), showing that gained subTAD boundaries are strongly associated with up-regulation of gene expression. (G) Enrichment of altered H3K27ac sites at altered subTAD, but not TAD, boundaries (O/E ratio). Dashed lined represents an O/E ratio of 1. (H) Increased average insulation score at sites of gained H3K27ac within TAD but not at TAD boundaries (colocalization: ±10 kb, range: 200 kb). (I) Pileup plots of increased interaction between gained H3K27ac and all sites of H3K27ac and H3K4me3 (range: 50 kb). See also SI Appendix, Fig. S5.

