Fig. 7.
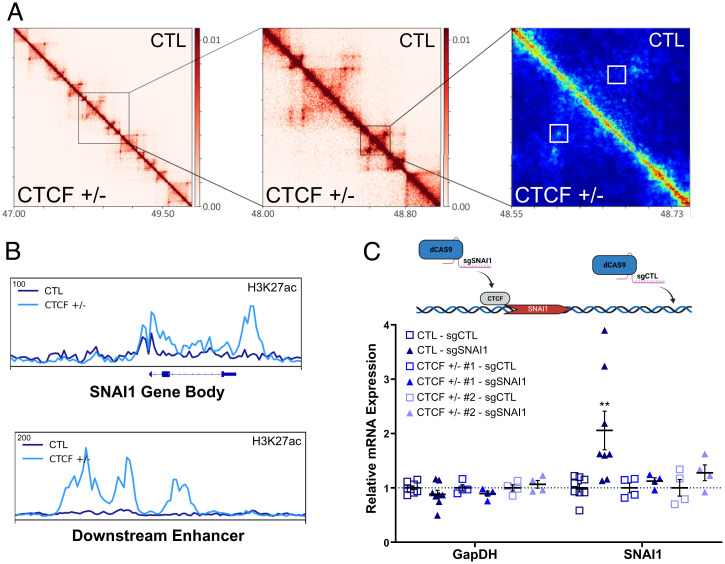
Loss of CTCF at SNAI1 drives reorganization of subTAD interactions. (A) Increasing zoom of the 10- and 5-kb resolution HiC heatmap to HIFI high-resolution heatmap around SNAI1 loci (chromosome 20, coordinates in megabases). Gain of enhancer-promoter interaction on the SNAI1 body, specific to CTCF+/− cells, shown in the white boxes in the HIFI heatmap. (B) ChIP-seq track of normalized read density of increased H3K27ac on the SNAI1 gene body and the downstream enhancer, which displayed a gain of interaction in A. (C) Mean ± SEM (error bars) and individual replicates mRNA expression, relative to sgCTL, of infected CTL and CTCF+/− MCF10A. SNAI1 mRNA levels (P = 0.0057) in CTL-sgSNAI1 compared to CTL-sgCTL. All other comparisons are nonsignificant. Top: Schematic of the experimental conditions. Dashed line represents a ratio of mRNA levels equal to 1, relative to controls, indicating unchanged mRNA. See also SI Appendix, Fig. S6.

