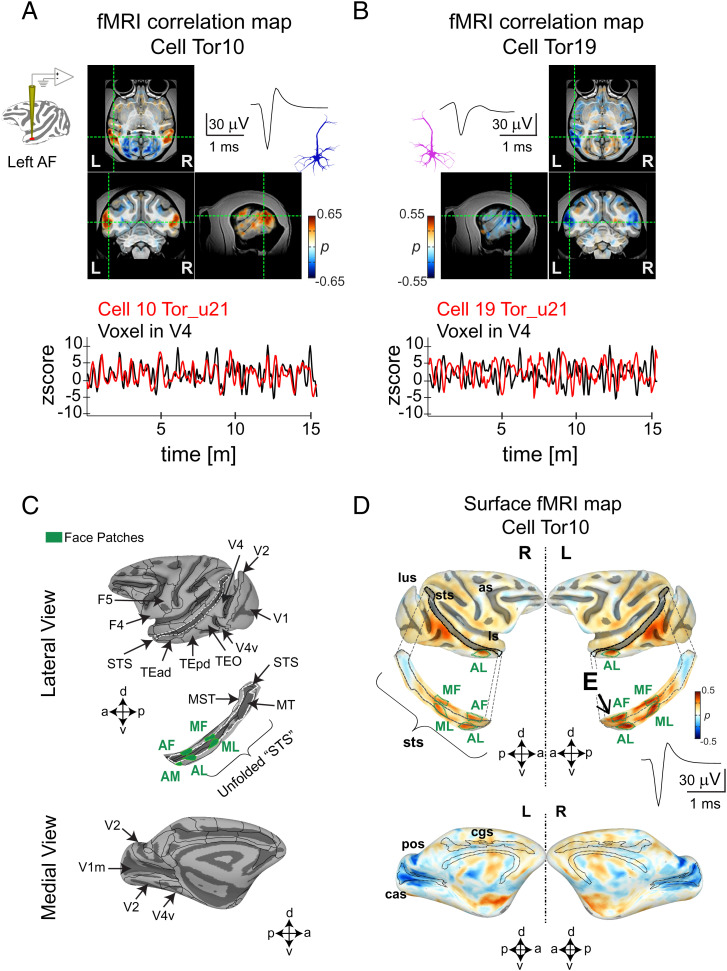
Fig. 2.
Examples of two single unit functional maps from neurons in the macaque AF face patch. fMRI maps (Top Panel) obtained from (A) cell Tor10 and (B) cell Tor19. The two example cells were recorded from the left hemisphere in monkey M1 during the same scan session (u21). The activation maps from these cells are displayed in the axial, coronal, and sagittal planes and are accompanied by their respective spike waves. Scale bar, 30 mV, 1 ms. Overlaid color maps represent the Spearman’s rank correlation coefficients for each voxel. Time series (Bottom Panel) corresponding to (A) cell Tor10 and to (B) cell Tor19 (both shown in red) are compared with the activity of an fMRI voxel time series (black). The location of the voxel time series is indicated by the dotted green lines on each plane (see also SI Appendix, Fig. S2 A and B for the whole brain functional maps corresponding to these cells). (C) Lateral (Top Panel) and medial (Bottom Panel) views of a macaque surface depicting the location of cortical regions relevant to the current study. Boundaries of functionally defined face patches are superimposed (green) in an unfolded STS. Abbreviations for face patches: AL, anterior lateral; MF, middle fundus; ML, middle lateral. (D), Averaged single unit functional map (n = 12 scans, 30 m each, total scan time 6 h), accompanied by the corresponding spike wave from cell Tor10 is plotted in the lateral (Top) and medial (Bottom) view of the cortical surface: as, arcuate sulcus; cas, calcarine sulcus; ios, inferior occipital sulcus; ls, lateral sulcus; lus, lunate sulcus; pos, parieto-occipital sulcus; cgs, cingulate sulcus; sts, superior temporal sulcus (see also SI Appendix, Fig. S2C for the functional maps stability across days). Activity in face patches is depicted in the unfolded STS surface where “E” indicates the electrode location.

