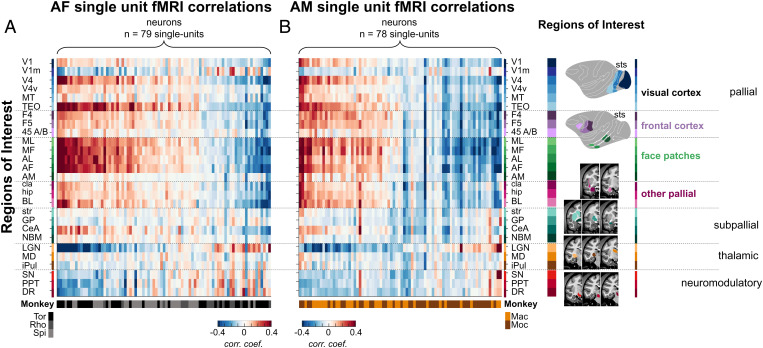
Fig. 4.
Similarity of single unit fMRI activation maps for AF and AM. fMRI correlation profiles across 27 functional regions of interest for each recorded single unit in (A) AF and in (B) AM. Each column (n = 157) represents a vector of 27 correlation coefficients from one neuron. All neurons are grouped based on their correlation profile similarity and monkeys from which they were collected. ROIs are listed and color coded according to their anatomical locations within the subdivisions of the standard developmental anatomical brain (Right), namely pallium (including visual areas, face patches, frontal areas; BL, basolateral amygdala; hip, hippocampus), subpallium (CeA, central amygdala; GP, globus pallidum; NBM, nucleus basalis of Meynert; str, striatum), thalamus (iPul, inferior pulvinar), and brainstem neuromodulatory centers (DR, dorsal raphe). See SI Appendix, Fig. S3 for the proportion of cells with positive and negative correlation maps and SI Appendix, Fig. S8 for the ROI names and their spatial extent.

