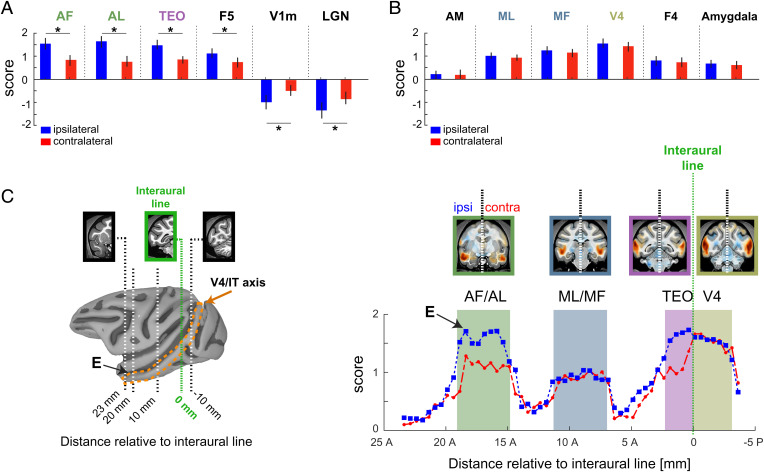
Fig. 5.
Interhemispheric differences in fMRI coupling to spiking activity from AF. Difference in functional activity between the recording hemisphere, or ipsilateral, and the contralateral hemisphere. (A) Comparison between the ipsilateral (shown in blue) and the contralateral (shown in red) hemispheres from regions showing a significant difference in the strength of fMRI association to the spiking activity. (B) Regions with no evident difference across the two hemispheres. (C) Distribution of the fMRI association strength to the spiking activity along the V4/IT axis (Right Panel). Shaded colored areas denote the relative spatial extent of visual cortical areas along V4/IT axis. The spatial extent of the V4/IT axis is indicated by the orange dotted lines in the cortical surface (Left Panel). X-axis in either panel depicts the coronal slice number relative to the interaural plane (dotted green line). “E” indicates the relative location of the recording electrode. See SI Appendix, Fig. S9 for results in AM.

