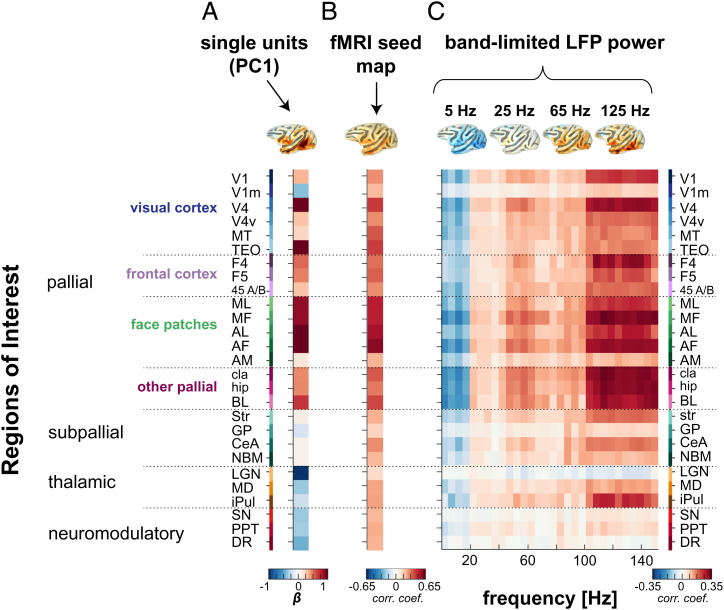
Fig. 6.
Comparison between spiking, fMRI, and LFP activity from AF face patch. Profile of fMRI activations from (A) the population spiking activity with (B) the averaged correlation profile associated to the fMRI seed in AF (seed across n = 20 scans) and with (C) the correlation profiles across different LFP frequency bands, where each column represents a vector of 27 correlations across LFP frequencies spaced by 5 Hz each (n = 30 columns representing 30 LFP frequencies). The correlation profiles are accompanied by their corresponding functional map plotted on a brain surface (Top Panel). The listed ROIs are ordered similarly as in Fig. 4 (see SI Appendix, Fig. S8 for the ROI names and their spatial extent; also see SI Appendix, Fig. S10 for functional maps corresponding to each signal modality and SI Appendix, Fig. S11 for results in AM).

