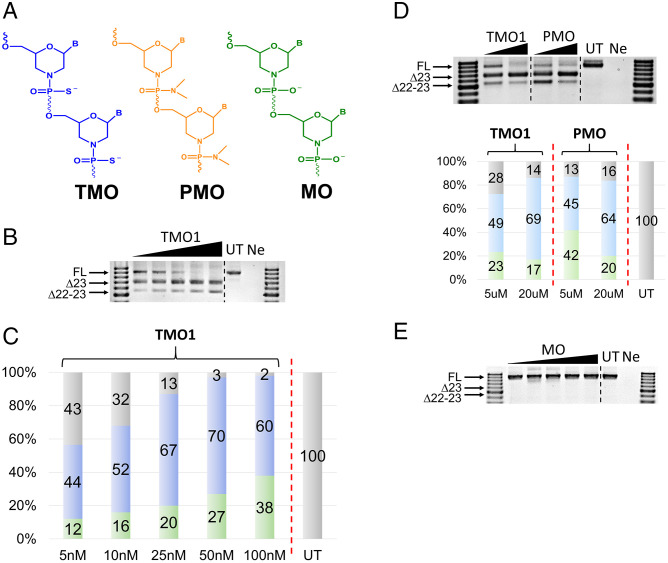
Fig. 1.
(A) Structural representation of TMO, PMO, and MO; (B) RT-PCR and (C) densitometry analysis of RNA prepared from H2K mdx mouse myotubes transfected with TMO1 ASO in the presence of lipofectin; (D) RT-PCR and densitometry analysis of RNA prepared from H2K mdx mouse myotubes transfected by nucleofection with TMO1 and PMO ASOs; (E) RT-PCR of RNA prepared from H2K mdx mouse myotubes transfected with MO ASO. The triangles above the gel images indicate increasing ASO concentrations (in B and E: 5, 10, 25, 50, and 100 nM; in D: 5 and 20 µM); FL (full-length) = 901 bp, Δ23 (exon-23 skipped) = 688 bp, Δ22–23 (exons-22 + 23 skipped) = 542 bp. In the bar graphs, FL is represented by gray, Δ23 by blue, and Δ22–23 by green. UT = untreated and Ne = negative control (RT-PCR sample with no RNA).

