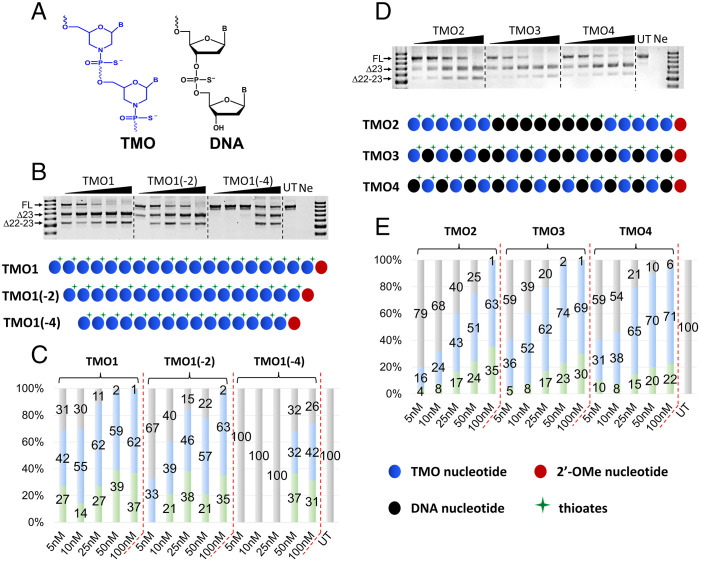
Fig. 2.
(A) Structural representation of TMO and DNA; (B) RT-PCR and (C) densitometry analysis of RNA prepared from H2K mdx mouse myotubes transfected with TMO1 and its truncated versions TMO1(–2) and TMO1(–4) in the presence of lipofectin; (D) RT-PCR and (E) densitometry analysis of RNA prepared from H2K mdx mouse myotubes transfected with TMO/DNA gapmer (TMO2) and mixmers (TMO3 and 4) ASOs in the presence of lipofectin. The triangles above the gel images indicate increasing ASO concentrations 5, 10, 25, 50, and 100 nM (B and D); FL = 901 bp, Δ23 (exon-23 skipped) = 688 bp, Δ22–23 (exons-22 + 23 skipped) = 542 bp. In the bar graphs, FL is represented by gray, Δ23 by blue, and Δ22–23 by green.

