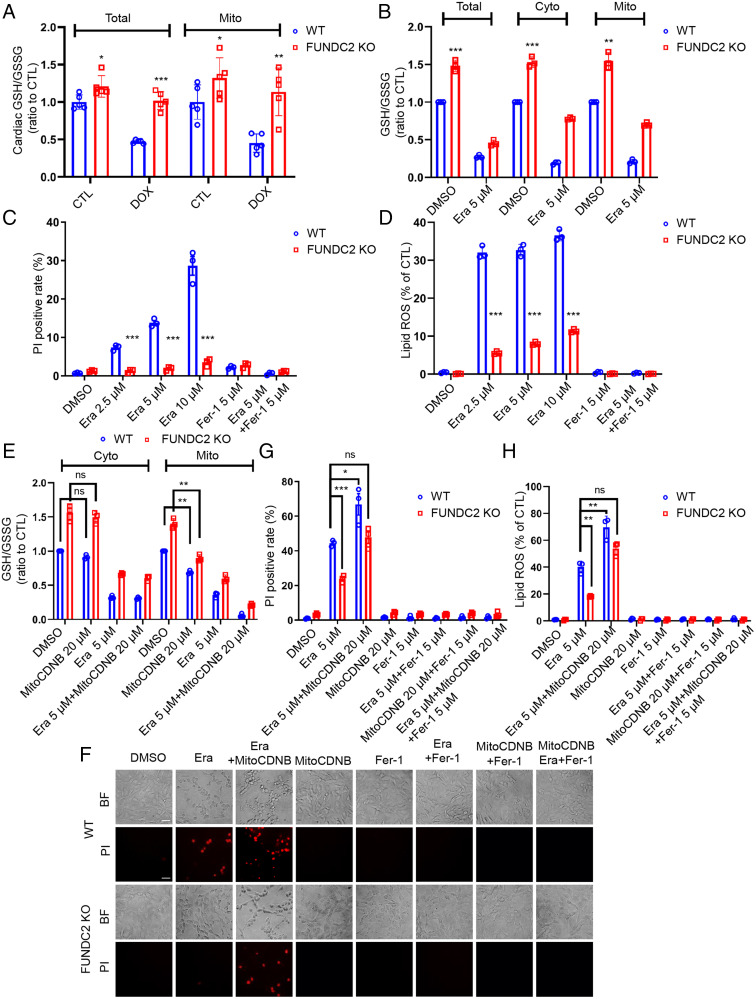
Fig. 3.
FUNDC2-KO inhibits but mitoGSH depletion increases erastin-induced cell death. (A) The cardiac glutathione (GSH)/GSSG ratio and the cardiac mitochondrial (mito) GSH/GSSG ratio of each mouse were measured in WT and FUNDC2-KO mice subjected to DOX or saline (control [CTL]). (B–D) Cellular, cytosolic (Cyto), and mitochondrial (Mito) GSH/GSSG ratio were determined in WT and FUNDC2-KO MEF cells after being treated with 5 μM erastin or dimethyl sulfoxide (DMSO) for 3 h (B). These two types of cells were treated with 2.5 μM, 5 μM, and 10 μM erastin or DMSO for 6 h or 4 h in the presence or absence of 5 μM Fer-1; after that, the cell death of each group was determined by PI staining coupled with flow cytometry (6 h) (C); and the lipid ROS level of each group was analyzed by C11-BODIPY staining coupled with flow cytometry (4 h) (D). (E–H) Cyto and Mito GSH/GSSG ratio were determined in WT and FUNDC2-KO MEF cells after being incubated with 5 μM erastin or DMSO for 3 h with or without the pretreatment of 20 μM MitoCDNB (E). In addition, both cell types pretreated with 20 μM MitoCDNB or not were incubated with 5 μM erastin or DMSO for 6 h or 4 h with the presence or absence of 5 μM Fer-1. Then cell death was visualized by PI staining coupled with microscopy in both the brightfield (BF) (Top) and fluorescent (Bottom) modes (Scale bar, 20 μm.) (F) at the same position and further analyzed by PI staining coupled with flow cytometry (6 h) (G); and the lipid ROS level was determined by C11-BODIPY staining coupled with flow cytometry (4 h) (H). Data from three independent experiments and statistical significance was calculated by Student’s t test; *P < 0.05, **P < 0.01, ***P < 0.001 and ns indicates no significance.

