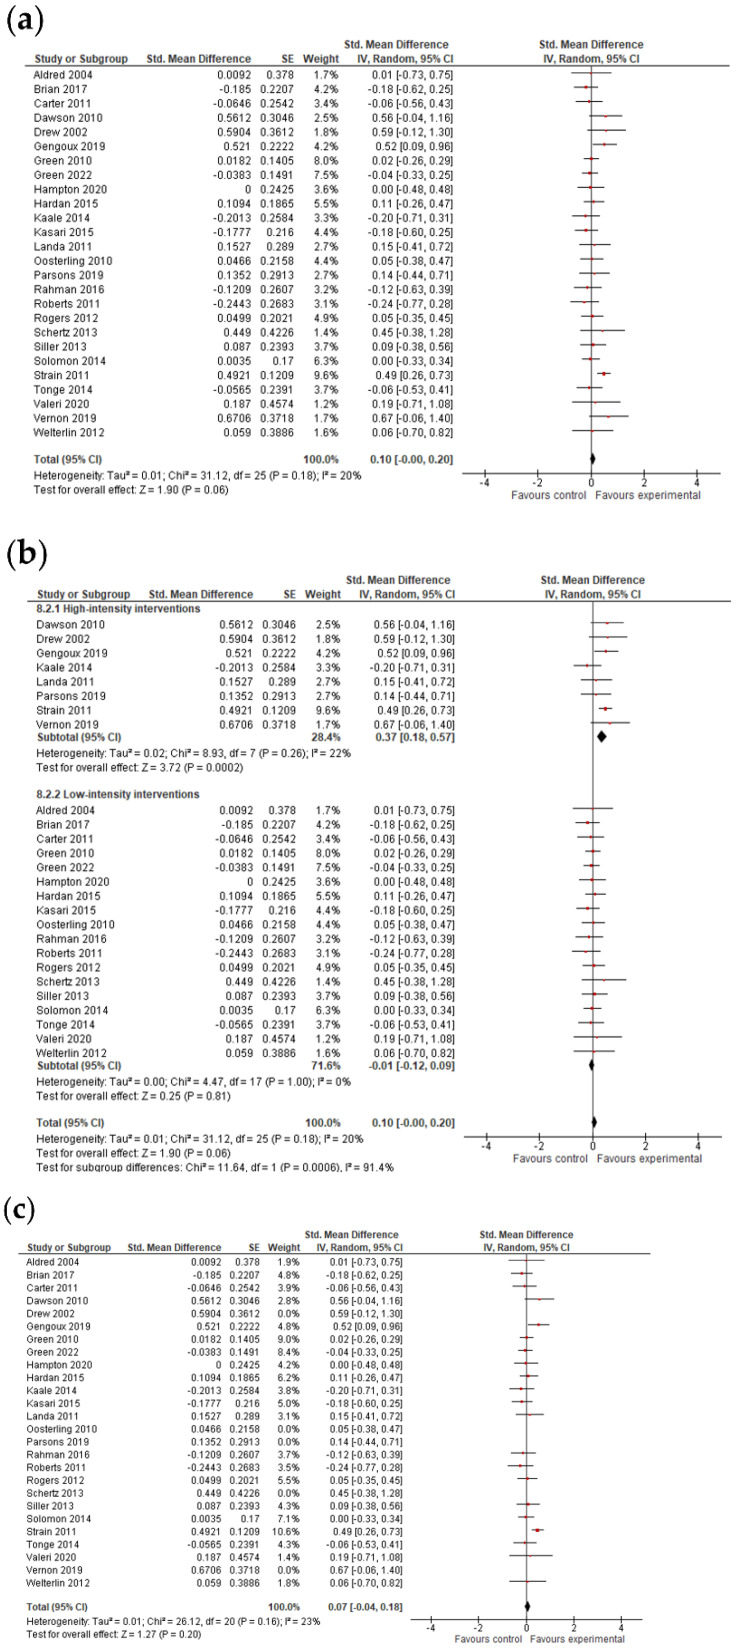
Figure 4.
Forest plots for expressive language results. (a) Overall effect [27,28,29,30,32,34,35,36,37,38,39,40,41,42,43,44,47,48,51,52,53,54,55,57,58,59]. (b) Subgroup analysis: intensity of intervention. (c) Results after exclusion of studies with no blinding of outcome assessment [27,28,29,30,34,35,36,37,38,39,40,41,44,47,48,52,53,54,55,57,59].

