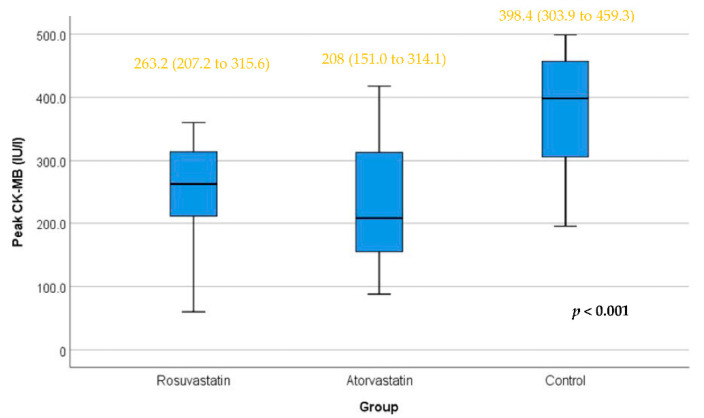
Figure 4.
Peak CK-MB level in the three study groups. Box represents the interquartile range. Line inside the box represents the median. Error bars represent minimum and maximum values. Differences between the rosuvastatin and control groups and between the atorvastatin and control groups were statistically significant (p-values < 0.01). The difference between the rosuvastatin and atorvastatin groups was not statistically significant. The test applied was the Kruskal–Wallis test.

