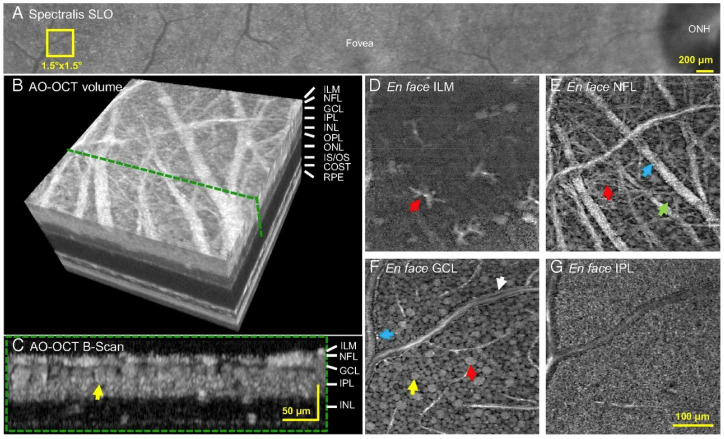
Figure 3.
Adaptive optics (AO) OCT showcasing cellular structures of the retina. Yellow 1.5 × 1.5 box in (A) (Spectralis scanning laser ophthalmoscope) showcases location imaged by AO-OCT. (B) 3D AO-OCT with layers and green dotted line showcases the cross-section of the retina in (C) with yellow arrow highlighting ganglion cell layer soma. (D–G) Different layers of the retina (internal limiting membrane, nerve fiber layer, ganglion cell layer, and inner plexiform layer). (D) Red arrow shows astrocyte/microglial cells. (E) Blue arrow shows nerve fiber webs. (F) Red arrow shows large soma, yellow arrow shows ganglion cell layer soma, blue and white arrows show edges of vessel walls. (G) Synaptic connections in the internal plexiform layer. Reprinted with permission from Liu et al. [50]. Imaging and quantifying ganglion cells and other transparent neurons in the living human retina. Proc. Natl. Acad. Sci. USA 2017; 114(48): 12803-8 with license permissions obtained from Creative Commons; Creative Commons Attribution-Non-Commercial-No Derivatives 4.0 International (CC BY-NC-ND 4.0, https://creativecommons.org/licenses/by-nc-nd/4.0/legalcode (accessed on 1 August 2022)).

