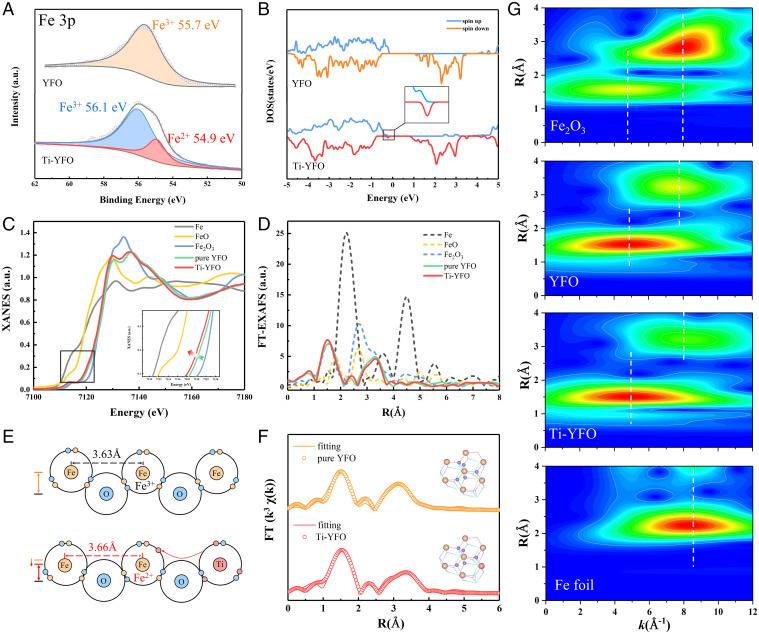
Fig. 3.
Structure characterization of catalysts. (A) XPS spectra of Fe 3p for YFeO3 and Ti-YFeO3. (B) Calculated projected density of states using DFT + U for Fe 3d orbitals. Normalized Fe K-edge XANES (C) and Fourier-transformed (FT) (D) curves at R space of Fe foil, FeO, Fe2O3, YFeO3, and Ti-YFeO3. (E) Schematic diagram of charge transfer and local structure change after modification. (F) The corresponding EXAFS spectra along with fits of YFeO3 and Ti-YFeO3. (G) WT contour plots of k (2)-weighted χ(k) signals from Fe foil, Fe2O3, YFeO3, and Ti-YFeO3.

