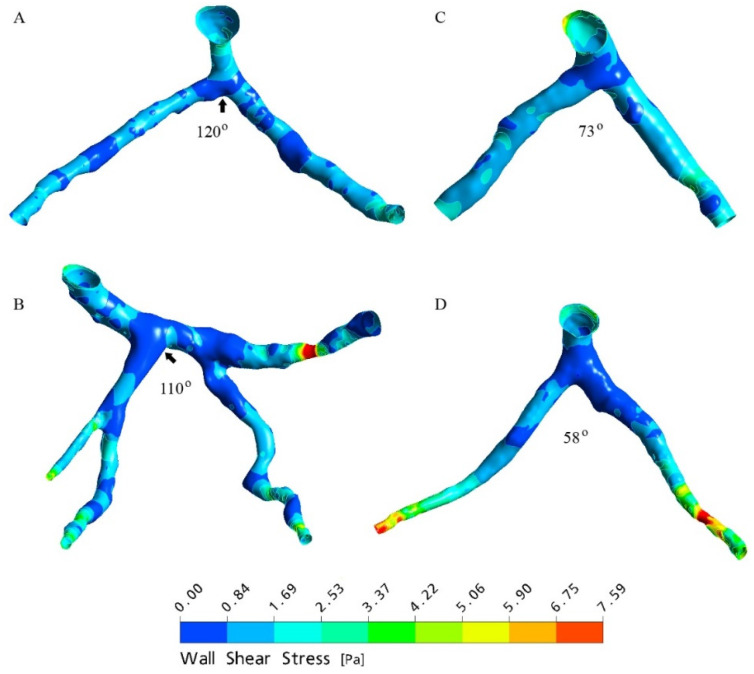
Figure 7.
Wall shear stress observed with variable angles of the realistic left coronary artery models generated at peak systolic phase of 0.4 s. (A,B) refer to models with wide LAD-LCx angles, while (C,D) refer to models with narrow LAD-LCx angles. Arrows refer to the low wall shear stress distributions at large bifurcations. Reprinted with permission from Chaichana et al. [11] 2011, Elsevier.

