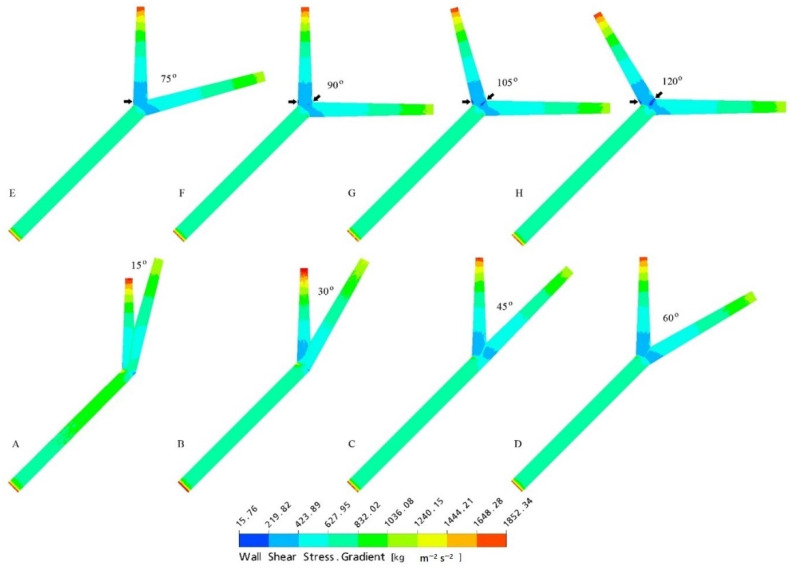
Figure 8.
Wall shear stress gradient observed with variable angles of the simulated left coronary artery models generated at peak systolic phase of 0.4 s. (A–H) simulated coronary artery models with different LAD-LCx angles ranging from narrow to wide angulation. Arrows refer to the wall shear stress gradient distributions and a big region of the low magnitude present at 120° angulation model. Reprinted with permission from Chaichana et al. [11] 2011, Elsevier.

