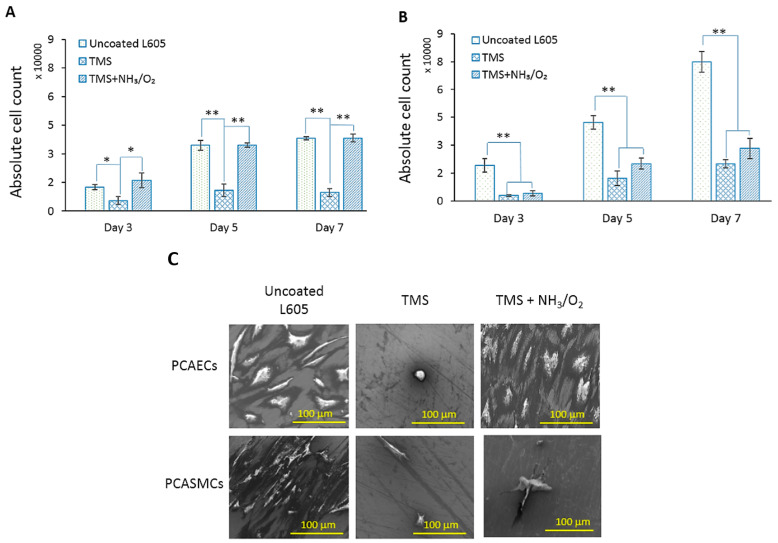
Figure 6.
(A) Absolute PCAECs counts after 3-, 5-, and 7-day cell culture on uncoated, TMS, and TMS+NH3/O2 plasma-nanocoated L605 coupons, performed with automated cell counting. Plotted values are means ± SD (n = 6); * p < 0.05 and ** p < 0.005. (B) Absolute PCASMCs counts after 3-, 5-, and 7-day cell culture on uncoated, TMS, and TMS+NH3/O2 plasma-nanocoated L605 coupons, performed with automated cell counting. Plotted values are means ± SD (n = 6); * p < 0.05 and ** p < 0.005. (C) SEM images (1000×) for PCAEC and PCASMC cell morphology after 7 days incubation on uncoated, TMS, and TMS+NH3/O2 plasma-nanocoated L605 surfaces, n = 3. TMS stands for TMS plasma-nanocoated L605, and TMS+NH3/O2 stands for TMS plasma-nanocoated L605 with NH3/O2 plasma post-treatment.

