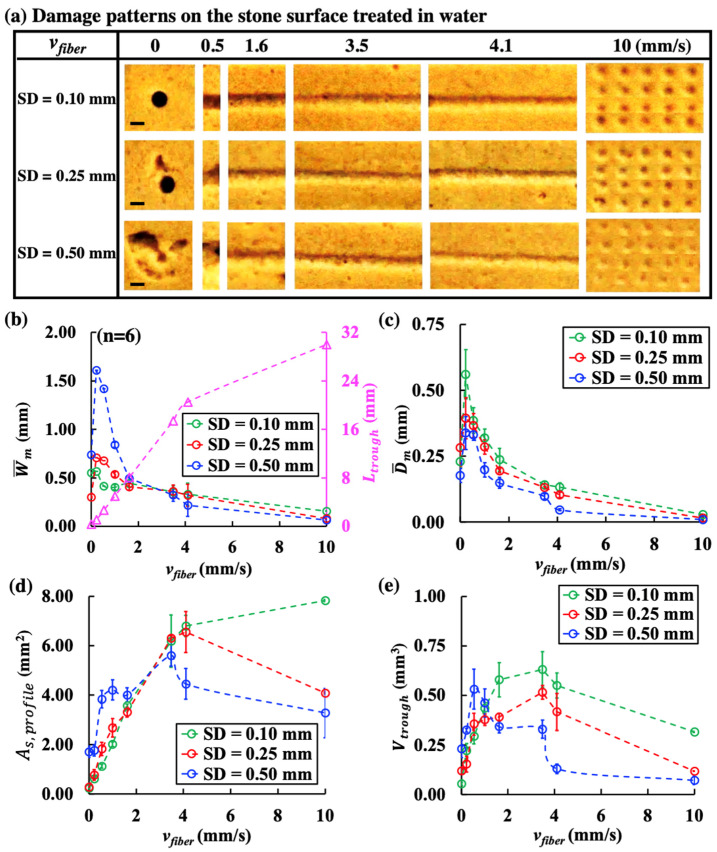
Figure 2.
Different damage patterns and characteristic dimensions of the trough produced in water by 100 pulses (0.2 J and 20 Hz) during scanning treatment at various fiber speeds (vfiber). (a) Damage craters produced by the stationary fiber (vfiber = 0 mm/s) and one-fifth of the damage troughs created at different vfiber under SD = 0.10, 0.25, and 0.50 mm (scale bar = 0.5 mm), (b) mean trough width () (small circles in different colors) and total trough length (Ltrough) (small purple triangles), (c) mean trough depth (), (d) surface profile area (As, profile), and (e) trough volume (Vtrough) quantified by OCT imaging analysis and plotted vs. vfiber.

