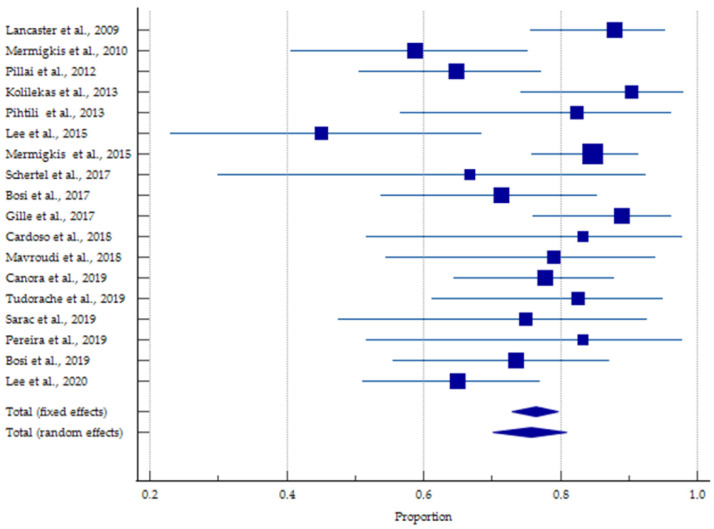
Figure 2.
Forest plot of the prevalence of obstructive sleep apnea among patients with idiopathic pulmonary fibrosis patients. Each square represents the effect estimate of a single publication, while horizontal lines represent a 95% confidential interval. The size of squares is proportional to the weight of each paper in the meta-analysis [5,31,32,33,34,35,36,37,38,39,40,41,42,43,44,45,46,47]. Exact data are available as Supplementary Table S3.

