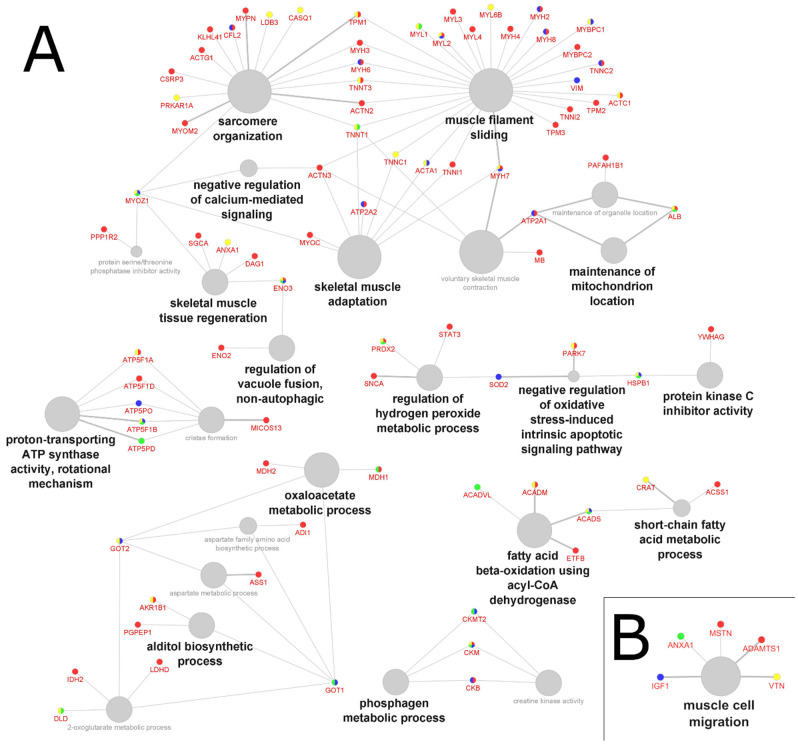
Figure 2.
GO clustering based on logical “AND” for all four atrophy groups in (A) tissue samples and (B) biofluid samples from 24 proteomics studies. Grey nodes represent common (shared) up- and downregulated processes; the font and node sizes reflect statistical significance (kappa score = 0.4 and p-value < 0.01). The red, blue, green, and yellow colors associated with proteins arbitrarily represent the muscle atrophy groups.

