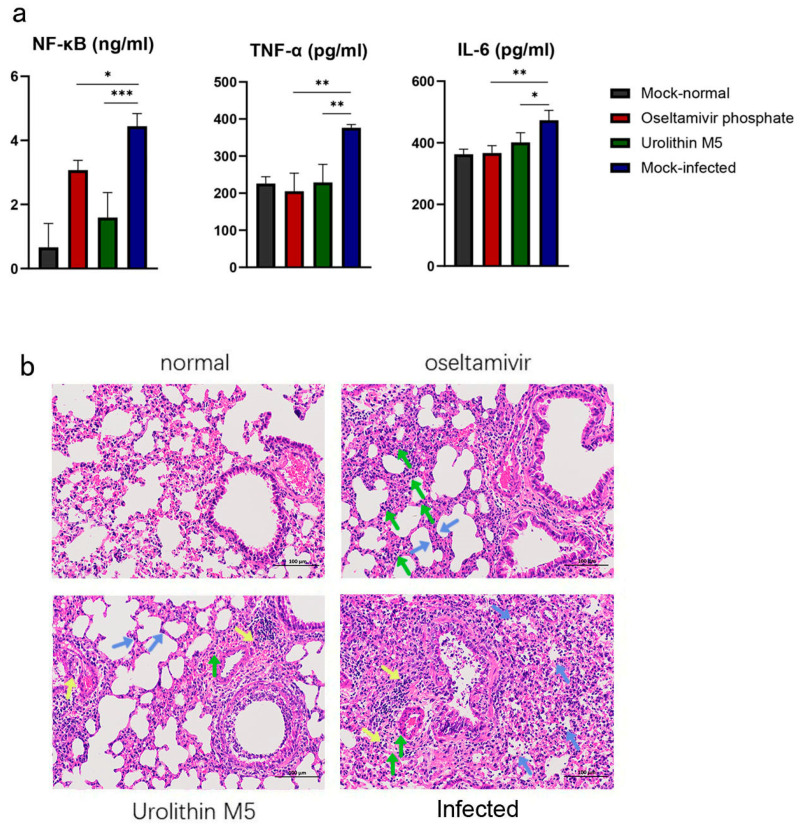
Figure 4.
(a) Effect of urolithin M5 treatment on NF-κB, TNF-α and IL-6 levels using ELISA assay. (b) Histopathologic changes of mice from the normal group, oseltamivir group, urolithin M5 group, and vehicle group on the fourth day. Inflammatory changes are labeled as interstitial expansion (green arrow), small vessel inflammatory cell infiltration (yellow arrow), and alveolar lumen inflammatory cell infiltration (blue arrow) (magnification: 200×). (* p 0.05, ** p 0.01, *** p 0.001).

