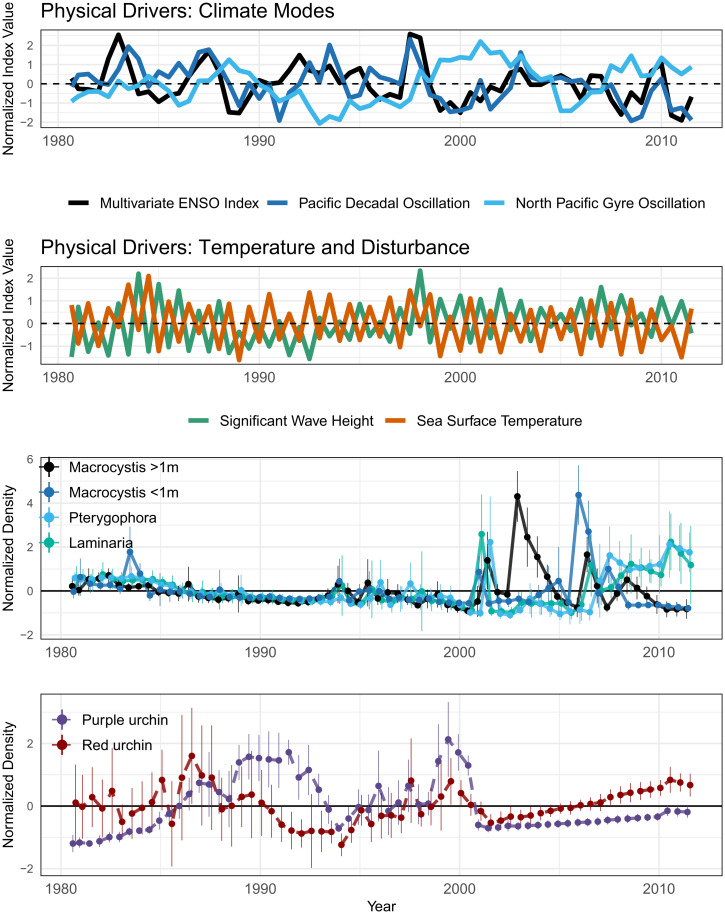
Fig. 1.
Raw data for species and physical drivers included in the study. Points represent mean values across 10 spatial replicates, while vertical lines represent ± 1 SD. All variables normalized to zero mean and unit variance, with linear time trends removed. Dashed lines distinguish herbivore (sea urchin) time series from time series of algae species.

