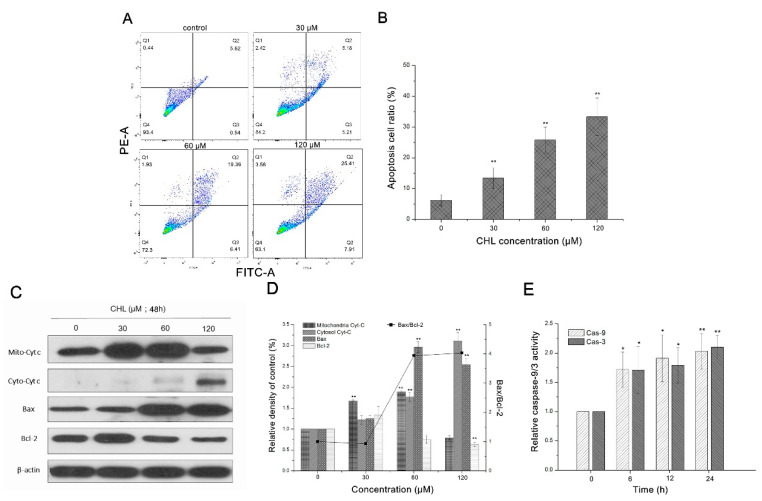
Figure 5.
Analysis of apoptotic effects of HepG2 cells after treatment with CHL. (A): Analysis of Annexin V/PI staining by flow cytometry. (B): Quantification of apoptotic cells. (C): Expression of apoptotic proteins by Western blot. (D): Quantification levels of apoptotic proteins. (E): Evaluation of caspase-3/9 activity by spectrophotometric analysis. ** p ≤ 0.01 and * p ≤ 0.05 vs. the negative control.

