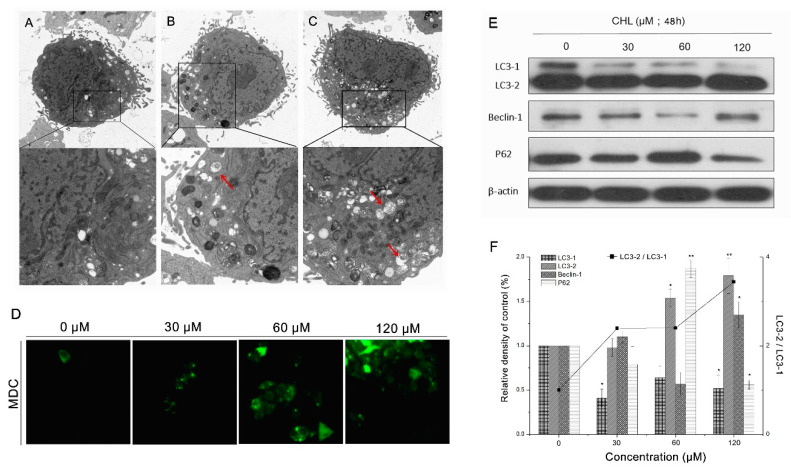
Figure 6.
Analysis of autophagic effects of HepG2 cells after treatment with CHL. Observation of autophagy characteristics in HepG2 cells via TEM. (A): Control cells with normal mitochondria in well shape. (B,C): 30 μM (B) or 60 μM (C) CHL-treated cells with autophagic vacuoles (red arrows). (D): Analysis of MDC staining by epifluorescence (200×). (E): Expression of autophagy-associated proteins by Western blot. (F): Quantification levels of autophagy-associated proteins. ** p ≤ 0.01 and * p ≤ 0.05 vs. the negative control.

