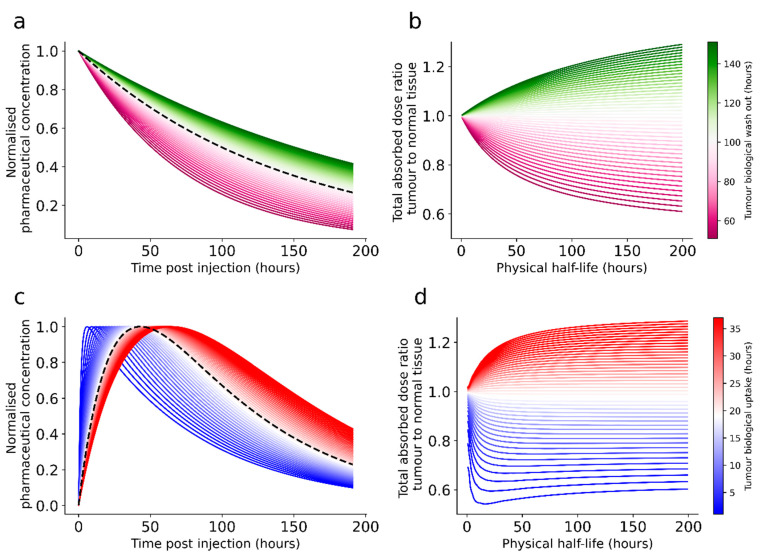
Figure 5.
The figure illustrates theoretical situations that involve biological uptake and clearance of a radiopharmaceutical in a normal organ and tumours (a,c) and the differences in absorbed dose ratios that can be expected by selecting radionuclides with various half-lives for each (b,d). Two different types of kinetics are illustrated. In both scenarios, the normal tissue kinetics (illustrated with a dashed black line) are kept fixed and the tumour kinetics are varied. In the first situation, illustrated in panel (a), with the corresponding ratios in panel (b), an instantaneous uptake and a mono-exponential elimination is assumed for both tumour and normal tissue. The initial amount of radiopharmaceutical per tissue is set identical for both normal organ and tumours. The tumour-curves have been colour-graded according to the biological half-life, where white is equal to the normal tissue elimination (here, 100 h), whereas more saturated green indicates a slower and saturated purple indicates a faster elimination compared to the normal tissue. In panel (b), the ratios between the total energy absorption between tumour and normal tissue for the different tumour eliminations have been plotted for a range of physical half-lives. In panel (c), a different situation with bi-exponential uptake and washout is illustrated. Here, the rate of wash-out is kept fixed, while the uptake phase is varied. Again, different theoretical tumours are shown in coloured whole lines, where more saturated blue is a faster uptake and more saturated red is a slower uptake, while the normal organ is represented by a black dashed line. The curves here have been normalised to the same maximum amount of radiopharmaceutical per tissue. In panel (d), the absorbed dose ratios between the tumours and the normal organ are plotted over a range of physical half-lives for this scenario.

