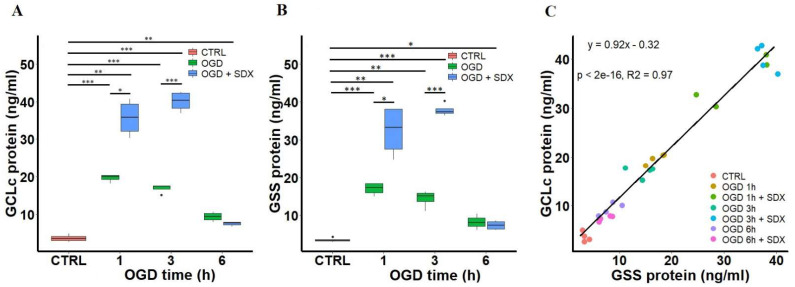
Figure 3.
Time-dependent effects of SDX on the protein levels of GCLc and GSS in human endothelial cells subjected to OGD. HUVECs were treated with OGD for 1, 3, or 6 h in the absence or presence of SDX (0.5 LRU/mL). Quantitative analysis of GCLc (A) and GSS (B) levels in cell lysates was performed by ELISA (n = 4). The GCLc and GSS protein concentrations (ng/mL) were normalized to total lysate protein. CTRL: normal conditions; OGD: cells exposed only to simulated ischemia in vitro; OGD + SDX: cells exposed to simulated ischemia in vitro and treated with SDX. Data in panels (A,B) are box-plots representing the median and quartiles with the upper and lower limits. Significant results are marked with asterisks (* p < 0.05; ** p < 0.01; *** p < 0.001); (C) Correlation between GCLc and GSS protein levels. Pearson’s correlation coefficient R2 = 0.97 was calculated from the linear regression analysis between concentrations of GCLc and GSS in cell lysates obtained from ELISA. [·] is the oulier.

