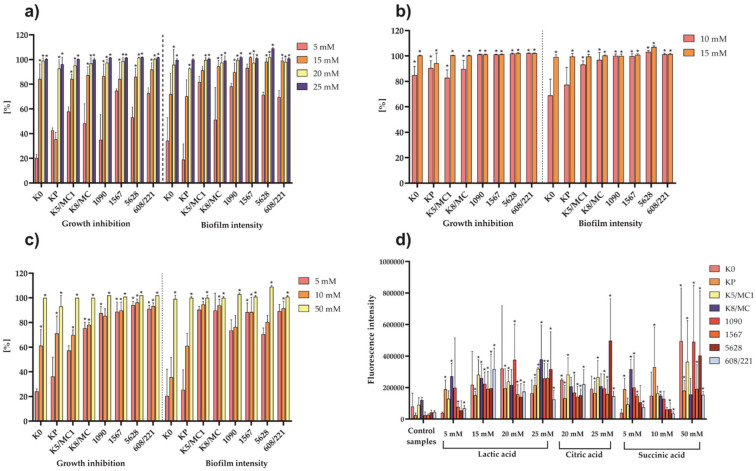
Figure 4.
The percentage of P. mirabilis strain growth and biofilm formation inhibition by lactic acid (a), citric acid (b), and succinic acid (c). The results are presented as the mean ± standard deviation (SD) of three experiments. * p < 0.05 for comparison of bacterial growth in the presence of tested organic acids vs. P. mirabilis culture without organic acids, according to Cochran’s Q test. (d) The fluorescence intensity of P. mirabilis in the control culture (without acids) vs. that in the culture incubated with different concentration of organic acids. The results are presented as the mean ± standard deviation (SD) of four experiments. * p < 0.05 for comparison of fluorescence intensity of P. mirabilis treated with acids vs. pure P. mirabilis culture, according to U Mann–Whitney test.

