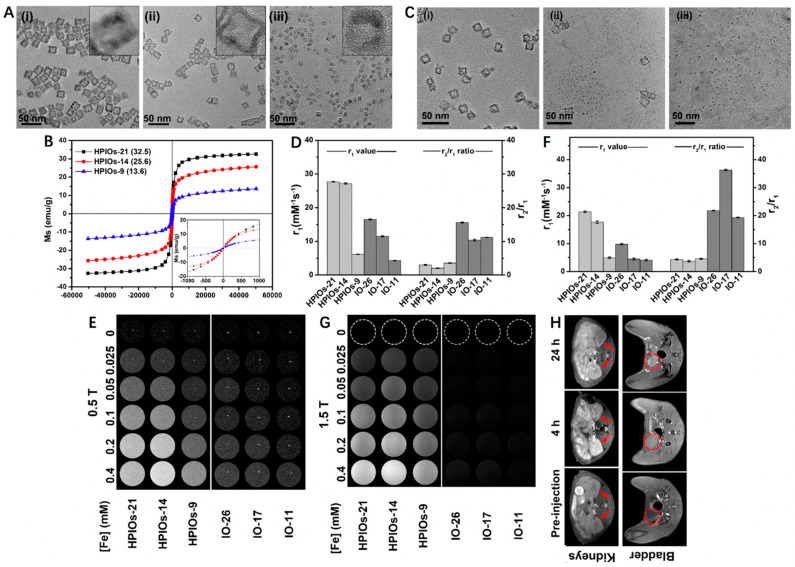
Figure 1.
(A) Transmission electron microscopy (TEM) images and high-resolution TEM (HRTEM) images (inset) of HPIOs-21 (i), HPIOs-14 (ii), and HPIOs-9 (iii). (B) Field-dependent magnetization curves (M−H) of HPIOs-21, HPIOs-14, HPIOs-9 at a magnetic field of 5 T at 300 K (insets: magnification of M−H curves from −1000 to 1000 Oe). (C) TEM images of HPIOs-14@ZDS incubated in PBS (pH 7.4) buffer for 1 (i), 2 (ii), and 4 (iii) h, respectively. Relaxation measurements of HPIOs and IOs at (D) 0.5 and (F) 1.5 T. T1-weighted phantom imaging of HPIOs-21, HPIOs-14, HPIOs-9, IO-26, IO-17, and IO-11 on (E) 0.5 T and (G) 1.5 T MRI scanners. (H) In vivo T1 MR imaging in the axial plane of rats before and at 4 and 24 h after injection of HPIOs-14 at a dose of 0.05 mmol Fe/kg body weight. Arrows and dotted circles indicate the kidneys and bladder, respectively. Reprinted with permission from Ref. [58]. Copyright 2018, American Chemical Society.

