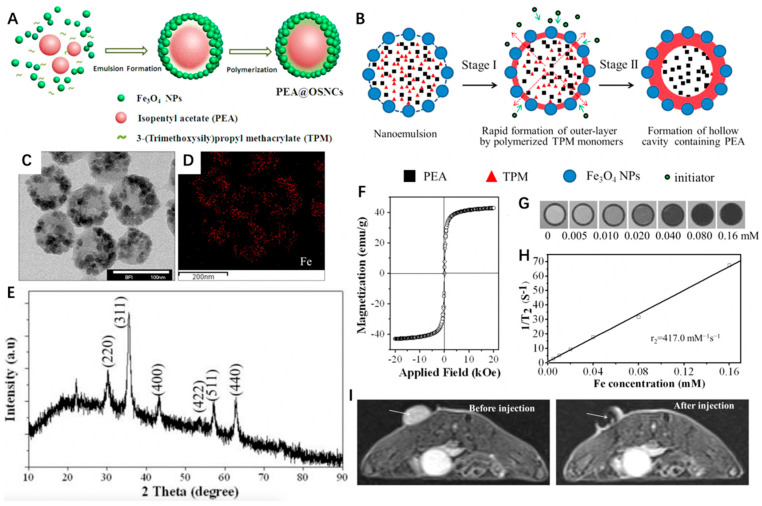
Figure 2.
(A) Schematic illustration of the synthesis of PeA@OSNC. (B) Schematic illustration of the structural conversion process from nanoemulsion to hollow structure. (C) TEM images of PeA@OSNC. (D) Fe element mapping corresponding to panel B, displaying the distribution of Fe3O4 nanoparticles in the overall structure. (E) XRD pattern of PeA@OSNC presents the characteristic diffraction peaks of magnetite (Fe3O4) crystals including (220), (311), (400), (511), (422) and (440) lattice planes. (F) Field-dependent magnetization curve of OSNC at room temperature. Absence of hysteresis loop confirms the superparamagnetism of our prepared sample. (G) T2-weighted MR phantom images and (H) plot of inverse transverse relationship times (1/T2) versus Fe concentration for OSNC. (I) In vivo MR imaging of tumor-bearing mice before and after intratumoral injection of PeA@OSNC suspension. Arrows point to tumor tissue. Reprinted with permission from Ref. [78]. Copyright 2016, American Chemical Society.

