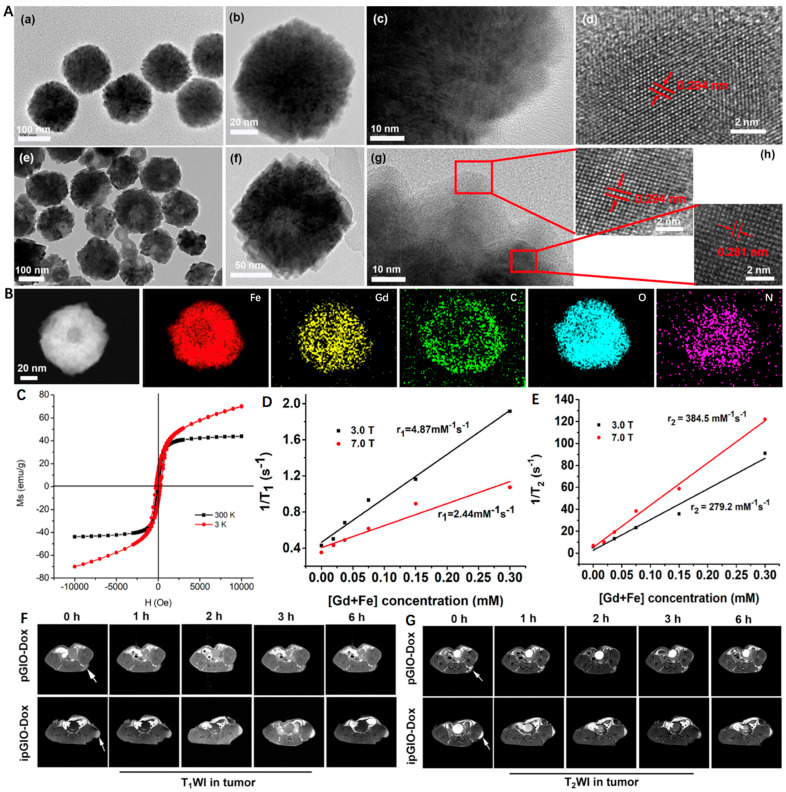
Figure 3.
(A) TEM images of (a–c) MIO and (e–g) GdIO. HRTEM images of (d) MIO and (h) GdIO. (B) Energy dispersive spectrometry mapping images of GdIO. (C) Field-dependent magnetization curve of GdIO at 3 and 300 K. (D) Transverse relaxation rate and (E) Longitudinal relaxation rate of ipGdIO-Dox measured using 3.0 T and 7.0 T MRI scanners. (F,G) T1- and T2-weighted MR images of cancer-bearing mice at coronal planes after injection of pGdIO-Dox and ipGdIO-Dox. Reprinted with permission from Ref. [81]. Copyright 2022, American Chemical Society.

