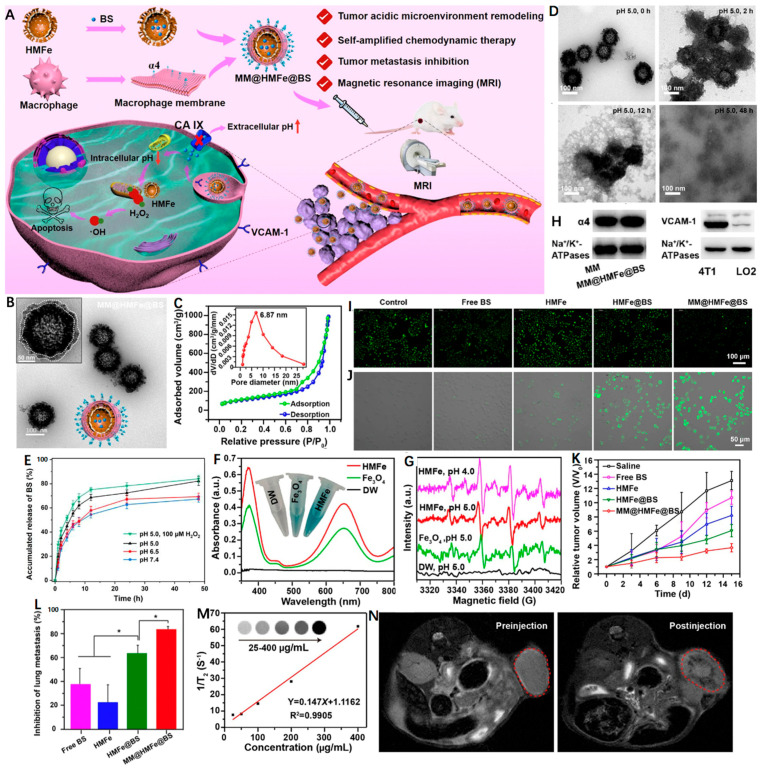
Figure 4.
(A) Illustration of MM@HMFe@BS for self-amplified chemodynamic therapy and tumor metastasis inhibition via tumor microenvironment remodeling under the monitoring of MRI. (B) Representative TEM images of MM@HMFe@BS. (C) Nitrogen adsorption−desorption curve of the HMFe. Inset shows the pore size of HMFe. (D) Time-dependent decomposition behavior of MM@ HMFe@BS. (E) In vitro release profiles of BS from MM@HMFe@BS at various pH values (5.0, 6.5, or 7.4) with or without H2O2. (F) UV−Vis absorption spectra of TMB after coincubation with DW (deionized water), solid Fe3O4, and HMFe in the presence of H2O2 (100 μM) at pH 5.0. (G) ESR spectra of detected •OH at different conditions. (H) Western blot analysis of α4 and VCAM-1 in macrophage membrane and 4T1 cells membrane, respectively. Fluorescence images of (I) BCECF-stained and (J) APF-stained 4T1 cells treated with free BS, HMFe, HMFe@BS, and MM@HMFe@BS for 12 h. (K) Relative tumor volume changes in 4T1 tumor-bearing mice with different treatments (n = 5). (L) Lung metastasis inhibition ratios on the 15th day post-treated with different formulations in contrast to control group (n = 5). (M) Linear plot of 1/T2 as a function of HMFe concentration. The inset is T2-weighted MRI images of HMFe. (N) In vivo MRI of 4T1 tumor-bearing mice before and after intravenous injection of MM@HMFe@BS. Reprinted with permission from Ref. [99]. Copyright 2022, American Chemical Society. * p < 0.05.

