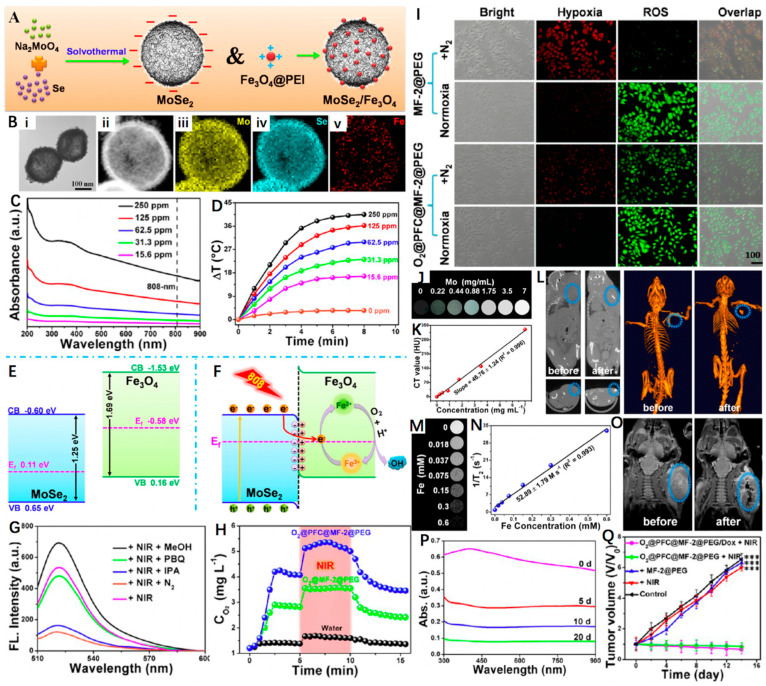
Figure 7.
(A) Schematic representation of MoSe2 and MoSe2/Fe3O4 nanomaterials. (B) TEM image of MF-2 and HAADF−STEM image of MF-2 and the corresponding STEM−EDX elemental mapping images for Se, Mo, and Fe. (C) UV−Vis spectrum of MF-2 with different concentrations. (D) Photothermal heating curves of MF-2 dispersions with different concentrations under an 808 nm laser (1 W cm−2) irradiation. (E,F) Schematic illustration of the energy band configuration of MoSe2 and Fe3O4 and possible mechanism of the charge separation of the MoSe2/Fe3O4 system. (G) Fluorescence spectra (excitation at 495 nm) of corresponding sample supernatants (300 μg mL−1) and DCFH-DA after irradiation by a NIR laser for 10 min (808 nm, 1 W cm−2) under different conditions. (H) O2 concentration changes after the addition of O2@MF-2@PEG or O2@PFC@MF-2@PEG into deoxygenated water under without and with 808 nm laser irradiation. (I) Fluorescence images of the cells stained with ROS and hypoxia probes. (J,K) In vitro CT images and relative CT values of MF-2 solution vs. different Mo concentrations. (L) CT images of a tumor-bearing mouse before and after injection in situ. (M,N) T2-weighted MR images and corresponding relaxation rates (r2) of MF-2 recorded using a 9.4 T MR scanner. (O) MR images for in vivo mapping before and after injection of MF-2@PEG. (P) Degradation time-dependent UV−Vis spectra of MF-2 in PBS. (Q) Changes in the relative tumor volume achieved after various treatments. Reprinted with permission from Ref. [108]. Copyright 2019, American Chemical Society. *** p < 0.001.

