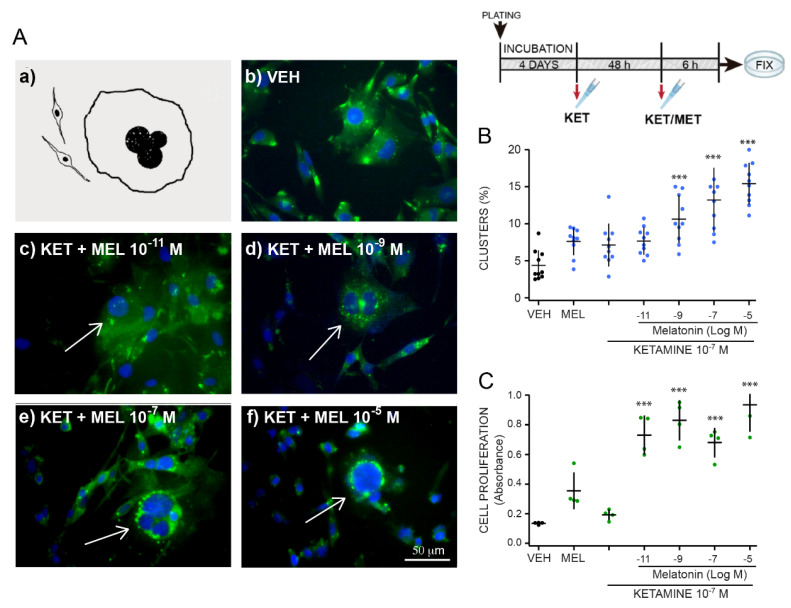
Figure 3.
Concentration response effect of melatonin in combination with ketamine on formation of clusters in ONPs cultures pre-incubated for 48 h with ketamine. Olfactory neuronal precursors were cultured during 48 h with either the vehicle (VEH) or ketamine (KET 10−7 M) and then with KET (10−7 M) together with various MEL (10−11 to 10−5 M) concentrations. Cells were fixed and stained with an anti-nestin antibody followed by a secondary antibody coupled to FITC (green), and DAPI (blue). The inset to the right, above, shows the treatment scheme. Panel A shows a diagram of a typical cluster (a). Representative merged images of neuronal precursors incubated with the VEH (b) or KET 10−7 M for 48 h followed by incubation with the combination of KET 10−7 M with either 10−11 M (c), 10−9 M (d), 10−7 M (e) or 10−5 M (f) MEL. Bar = 50 μm. Clusters are pointed at using an arrow. Panel B shows the graph of the effect of melatonin on cluster formation in cells preincubated with 10−7 M KET for h. Clusters were counted in 10 fields in cultures treated as described and normalized by total number of cells in the field counted by DAPI staining (n = 10). Panel C shows a graph of the concentration–response curve of MEL effects on cell proliferation of ONPs cultured with KET 10−7 M determined by formazan formation. Each point represents the mean of absorbance values measured in 4 wells. The mean ± standard deviation of the mean (SEM) is from 1 or 2 experiments performed by quadruplicate. Each experiment was repeated three times. Data was analyzed by one-way ANOVA with Dunnett´s post-test. *** p = 0.001 when compared with vehicle (VEH) control.

